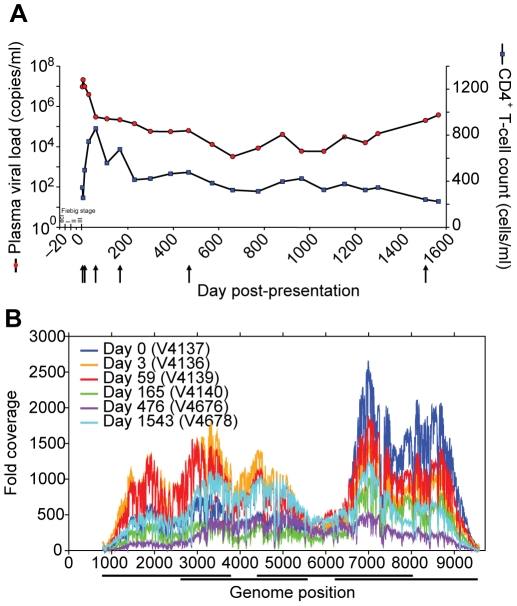
Figure 3. Clinical course and whole genome deep sequence coverage for subject 9213.
(A) Clinical course of infection in subject 9213 shown as days post-presentation. Plasma viral load (copies/ml) is shown in red and CD4+ T cell count (cells/ml) in blue. Estimated acute/early Fiebig stages are shown and arrows indicate time points sequenced on the deep sequencing platform. (B) High-quality sequencing reads per site across the HIV-1 genome for subject 9213 at six time points (days post presentation). Reads are aligned to the consensus assembly of their respective time point using Mosaik v1.0 (Table S9 in Text S1) and coverage (sequencing reads per site) calculated from bases that pass the defined Neighbor Quality Standard (NQS, see Supplementary Methods in Text S1) [28]. PCR amplicon locations are denoted by horizontal bars under the x-axis.

