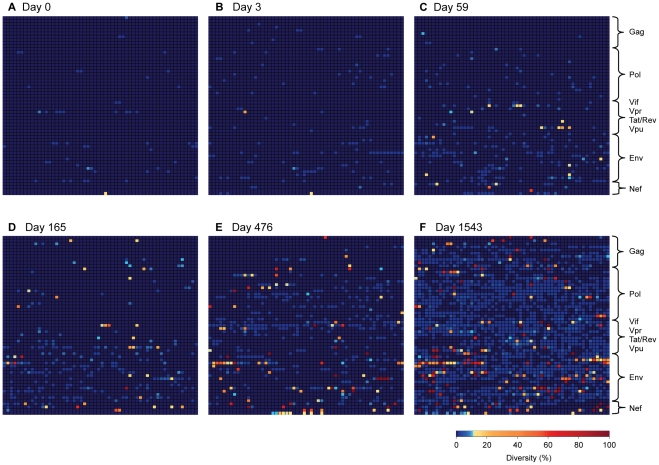
Figure 4. Rapidly expanding sequence diversity during HIV-1 infection.
Heat maps illustrate sites exhibiting amino acid sequence diversity at days 0, 3, 59, 165, 476 and 1543 post-presentation. Plotted is the percentage of amino acid diversity at each position with respect to the dominant baseline (day 0) amino acid residue. All 3174 amino acids of HIV-1 are represented, with the first amino acid of Gag located in the top left corner of the grid and the last amino acid of Nef located in the bottom right corner. Completely conserved residues are dark blue, low-level variant residues (<10% divergent from baseline) are light blue, moderately variable residues (10–50%) in orange, and highly variant residues (>50%) in red. (A) 0 days p.p., (B) 3 days p.p., (C) 59 days p.p., (D) 165 days p.p., (E) 476 days p.p., (F) 1543 days p.p..

