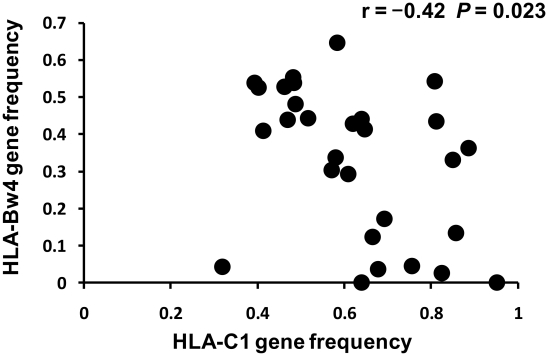
Figure 4. Negative correlation between HLA-C1 and HLA-Bw4 gene frequencies in 29 populations.
Vertical and horizontal axes indicate HLA-Bw4 and HLA-C1 gene frequencies in the 29 populations, respectively. Pearson's product-moment correlation coefficient was applied to these data. Data for the 29 populations were obtained from an earlier report (Single et al., 2007) [15].

