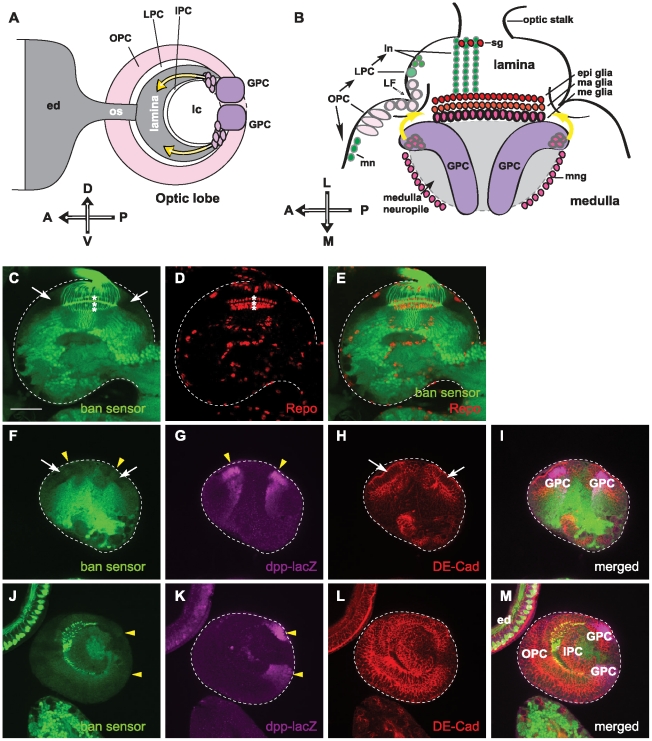
Figure 1. bantam is differentially expressed within the optic lobe.
(A, B) The schematic diagrams illustrate the third instar larval visual system. (A) Lateral view with anterior left, posterior right, dorsal up, and ventral down. All brains are oriented in the same direction in the lateral and horizontal views in all the figures. Photoreceptor neuron axons from the eye disc (ed) project through the optic stalk (os) into the optic lobe (crescent shape in gray). Glial precursor cell (GPC) regions are labeled in magenta. Yellow arrows indicate the migrating paths of lamina glial cells from GPC to the lamina target region. The outer proliferation center (OPC); the lamina precursor cell (LPC); the inner proliferation center (IPC); and the lobula complex (lc) are labeled. (B) Horizontal views show anterior left, posterior right, and lateral up. Neuroblasts in the OPC closest to the lamina furrow (LF) give rise to the LPC, which in turn divides to produce lamina neurons (ln). Neuroblasts in the OPC close to the medulla generate medulla neurons (mn). Three layers of lamina glial cells set the boundary of the lamina and medulla. Subtypes of glia are labeled and include: satellite glia (sg), epithelial glia (epi glia), marginal glia (ma glia), medulla glia (me glia), and medulla neuropil glia (mng). GPC areas are located at the prospective dorsal and ventral margins of the optical lobe at the superficial focal plane of horizontal view. Yellow arrows indicate the migrating paths of lamina glial cells from GPC to the lamina target region under the lamina furrow. (C–E) Shown is one focal plane of a horizontal view, where three rows of lamina glial cells are present. The dashed line outlines the brain. (C) The bantam sensor (green) shows high expression levels in photoreceptor axons and neurons in the medulla, but very low expression levels in OPC cells (white arrows) and lamina glial cells (asterisks). (D) Glial cells are labeled by anti-Repo staining (red). Three rows of laminal, epithelial, marginal and medulla glial cells are visible (asterisks). (E) merged images. (F–I) Shown is one focal plane of a superficial horizontal view, where the GPC regions are present. (F) The bantam sensor (green) shows low expression levels in the OPC (white arrows) and GPC regions (solid yellow arrowheads). (G) The GPC regions are labeled by dpp-lacZ and stained for β-galactosidase (magenta)(noted by solid yellow arrowheads). (H) Anti-DE-cadherin is labeled (red) to view the neuroepithelial cells in the OPC (white arrows). (I) merged images. (J–M) Shown is one focal plane of a lateral view, where the GPC, OPC and IPC are visible. (J) The bantam sensor (green) shows high expression levels in the photoreceptor neurons of the eye discs, and low expression levels in the OPC, IPC and GPC regions. (K) GPC regions (solid yellow arrowheads) are located at the dorsal and ventral margin of the posterior optic lobe, and were labeled by dpp-lacZ and stained for β-galactosidase (magenta). (L) Anti-DE-cadherin is labeled (red) to view the neuroepithelial cells in the optic lobe. (M) merged images. Scale bar: 50 µm.

