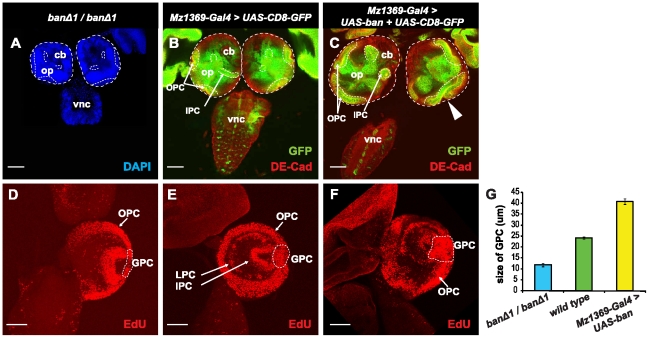
Figure 2. bantam is required for proliferation in the optic lobe.
(A, B, C) Brains are positioned with a horizontal view on a similar, single focal plane, and images were taken at the same magnification. A dashed line for brain size comparison outlines the brain surface. (A) A banΔ1/banΔ1 null mutant is shown. The brain is stained with DAPI (blue) in order to view all the cells. (B, C) UAS-CD8-GFP (green) is used to view the expression of Mz1369-Gal4 in the optic lobe. DE-cadherin staining (red) is used to view neuroepithelial cells in the OPC and IPC. Part of the OPC and IPC can been seen at this focal plane, and outlined by the dashed line. op, optic lobe; cb, central brain; vnc, ventral nerve cord. (B) wild type brains; (C) Over expression of bantam causes a broader size of the optic lobe and folded neuroepithelia (white arrowhead). (D–F) The brains are positioned for a lateral view. The projection images are from multiple section planes that cover all proliferation centers in the optic lobe. EdU staining (red) shows cell proliferation in the brain. DAPI (blue) is used to view the outline of the brain. The OPC, LPC, and IPC are labeled with white arrows, and the GPC is outlined with a white dashed line. Genotypes: (D) banΔ1/banΔ1; (E) UAS-CD8-GFP/+; Mz1369-Gal4/+; (F) UAS-CD8-GFP/+; Mz1369-Gal4/UAS-ban. (G) histograms of the diameter of the GPC region in the optic lobe of third-instar larvae. The measurements were taken in the circled areas in D, E, and F; banΔ1/banΔ1 (11.82±0.78 µm, n = 6), wild type (24.27±0.45 µm, n = 12), Mz1369-Gal4>UAS-ban (40.93±1.2 µm, n = 14). Scale bar: 50 µm.

