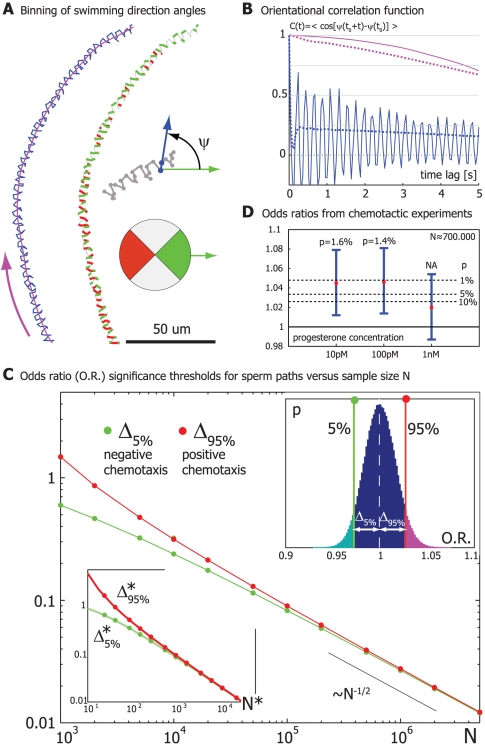
Figure 1. Directional persistence of sperm swimming paths prompts adapted statistical test for motion bias.
A. One out of 30,000 control human sperm tracks (blue) and the corresponding averaged swimming path (purple; computed using a second-order Savitzky-Golay filter). The fast wiggling of the sperm head center is clearly visible. For later odds ratio calculations, angles ψ between a preferred direction and the frame-to-frame displacement vectors were binned according to the color wheel shown; the color-coded track illustrates the binning. B. Orientational correlation function C(t) of the swimming direction angle ψ for the sperm track from panel A (solid blue). This correlation function shows fast oscillations resulting from periodic head wiggling as well as slow decay on a time-scale of several seconds, which reflects directional persistence of sperm swimming. Also shown is a sample average of this autocorrelation (dotted blue) computed by averaging individual angle autocorrelation functions from n = 4,000 long sperm tracks (duration >10 sec). We can further define an analogous angle autocorrelation function for the direction angle of the averaged path (solid purple: for the averaged path from panel A; dotted purple: sample average). C. Empirical significance thresholds for the odds ratio of swimming direction angles for a human sperm population assay: An odds ratio O.R. = (N +/N −)/(N + 0/N − 0) greater than 1+Δ95%(N) with sample size N = min(N ++N −,N + 0+N − 0) should be statistically significant for positive chemotaxis at a 5%-confidence level. The test for negative chemotaxis reads O.R.<1−Δ5%. Significance thresholds were determined by block bootstrapping based on a large control data set of swimming direction angles of 30,000 sperm tracks. For various sample sizes N, we sampled a distribution of odds ratios by computing odds values for suitable random subsamples of size about N. Each subsample comprises the full angle data corresponding to a random selection of tracks. Upper inset: Distribution of odds ratios for N = 106 by bootstrapping. The 5% and 95% percentiles of this distribution represent the significance thresholds 1−Δ5% and 1+Δ95%, respectively. Lower inset: Significance thresholds Δ*5% and Δ*95% for a simulated control data set devoid of correlations as a function of test sample size N* (continuous lines, green Δ*5%, red Δ*95%). We obtain almost identical “significance thresholds”, if we employ simple bootstrapping drawing subsamples from pooled experimental angle data (not shown). The significance thresholds determined by block bootstrapping (open symbols, green Δ5%, red Δ95%) superpose with those for the simulated control data if we renormalize sample size as N* = 0.029N, i.e. Δ*5%(N*) ≈Δ5%(N) and Δ*95%(N*)≈Δ95%(N). N* can be regarded as an effective number of independent data points in an experimental sample of size N. D. Odds ratios characterizing biased motion of human sperm cells in a concentration gradient of the chemoattractant progesterone for various initial concentrations (black dots). Errorbars denote symmetric 90%-confidence intervals that were determined using bootstrapping based on the data from this particular experiment. Using bootstrapping on a separate, very large control data set, we can assign accurate significance levels p to each odds ratio. These significance levels represent the likelihood that the odds ratios in this particular experiment were drawn from the control distribution.

