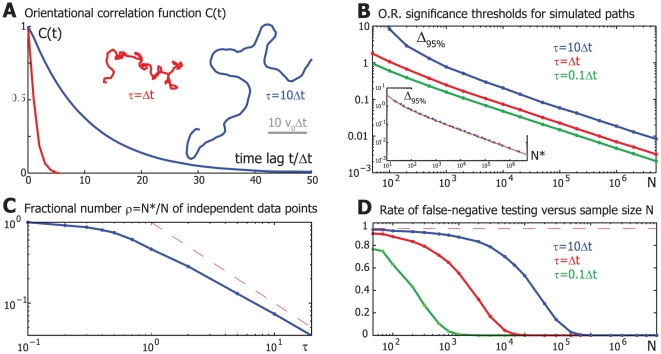
Figure 2. Effect of tunable directional persistence on tests of motion bias for a simple mathematical model of stochastic swimming paths.
A. Orientational correlation function C(t) of the (frame-to-frame) swimming direction angle of simulated persistent random walks for two values of the persistence time τ = Δt (red) and τ = 10Δt (blue). Also shown are two example tracks. B. 95% percentile of the odds ratio distribution of simulated persistent random walks as a function of sample size N for different values of the persistence time τ (green: τ = 0.1Δt, red: τ = Δt, blue: τ = 10Δt). (For each value of τ, we used simulated control data sets each comprising 104 persistent random walks of duration 100Δt.) Lower inset: Significance threshold Δ*95% for a simulated control data set devoid of correlations as a function of test sample size N* (magenta line). The significance thresholds determined by block bootstrapping of simulated persistent random walks superpose with those for the correlation-free control data if we renormalize sample size as N* = ρN, i.e. Δ*95%(N*) ≈Δ95%(N). N* can be regarded as an effective number of independent data points in a sample of size N. C. The “effective number of independent data points” N* in a sample of size N of angles of simulated persistent random walks is a function of the persistence time τ. The ratio N*/N was determined from a superposition of percentiles-curves of the odds ratio distribution for different values of τ by rescaling N→N* (“data collapse”), see inset of Figure 2B. D. We can test simulated biased persistent random walks for the presence of biased motion by comparing the corresponding odds ratio to “empirical” significance thresholds as computed in Figure 2B. This involves the risk of type-II errors (“false negatives”), in which biased motion is falsely classified as unbiased (the null hypothesis is falsely accepted). The rate of such a type-II errors decreases with sample size N, but increases with the persistence time τ of the biased persistent random walks (green: τ = 0.1Δt, red: τ = Δt, blue: τ = 10Δt). Parameter: β = 0.1. (Note that curves do not superpose as a function of the effective number N* of independent data points as the mean of the odds ratio distribution <O.R.> depends on τ. This is a result of our use of frame-to-frame displacements vectors and an effective averaging of stochastic turning for τ<Δt. If the hypothetical experimentalist could sample instantaneous swimming directions at discrete times, the corresponding <O.R.> would be largely independent of τ and the corresponding error rate curves would superpose.)

