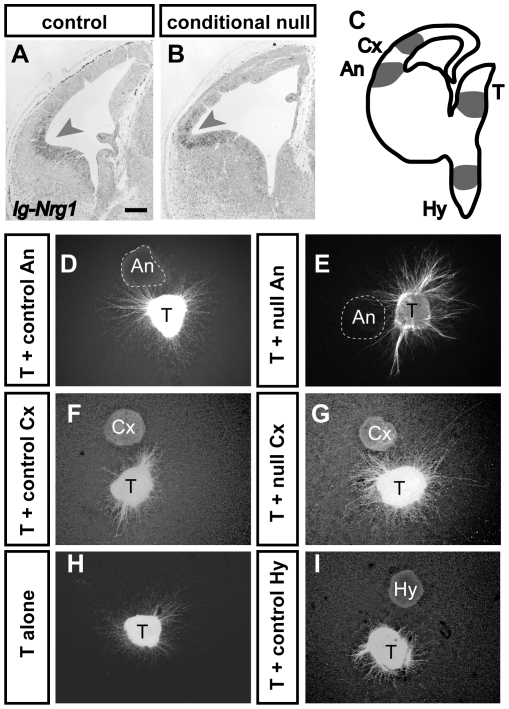
Figure 7. Control and Apc−/− angle region express molecules that stimulate thalamic growth.
(A, B) In situ hybridizations show expression of Ig-Nrg1 with highest intensity around the angle region (arrowheads). Scale bar: 200 µm. (C) This diagram shows the regions from which explants were taken for co-culture experiments: Cx, cortex; An, angle region; T, thalamus; Hy, hypothalamus. (D–I) Examples show six cultures, each containing thalamus and a different co-cultured tissue or, in H, thalamus alone.

