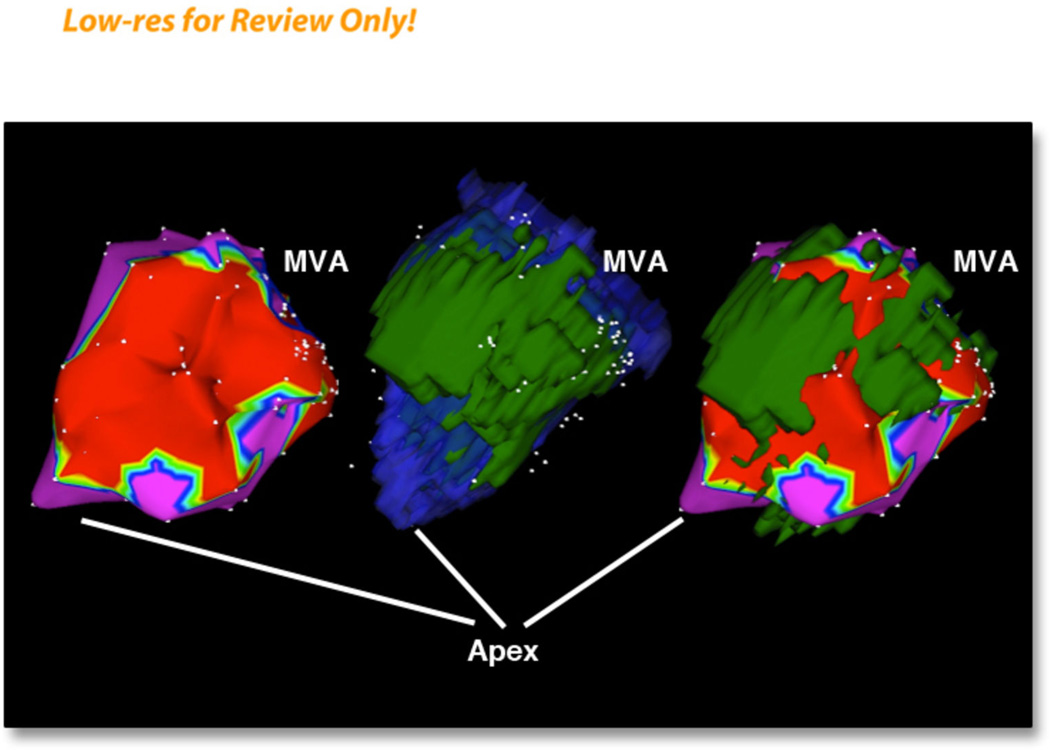
Figure 2. A series of three images of electroanatomical maps and 3 –D reconstruction of scar and left ventricular endocardium.
Left panel: voltage map with a cut-off voltage of 1.5 mV.
Middle panel: merged endocardial MRI shell (blue color) with scar shell (green color)
Right panel: merged MRI scar (green color) with electroanatomical map.

