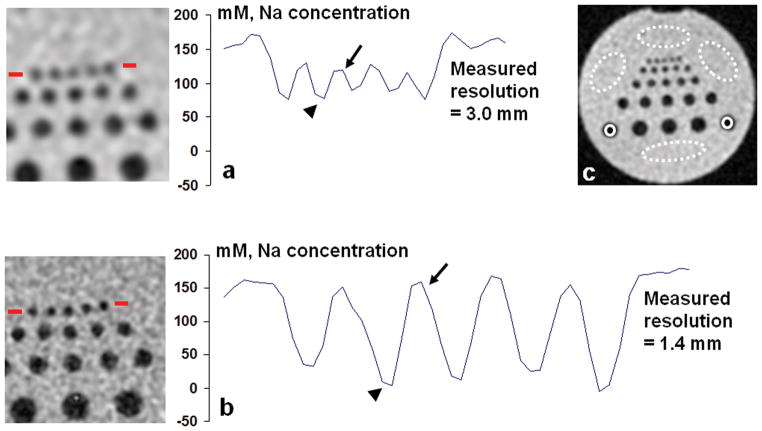
Fig. 2.
Quantification of sodium concentration on the images of a resolution phantom at 7T at actual resolutions of (a) 3.0 mm and (b) 1.4 mm. The regions for calibration were shown in (c): four signal regions (dashed ellipses) and two noise-only regions (solid circles). A profile of the quantified sodium concentration across the row of small rods (2mm diameter) as shown in the left image was plotted for both resolutions. The high resolution (b) produced values for the solution (arrow) and rod (arrow head) regions with much smaller errors than the low resolution (a).

