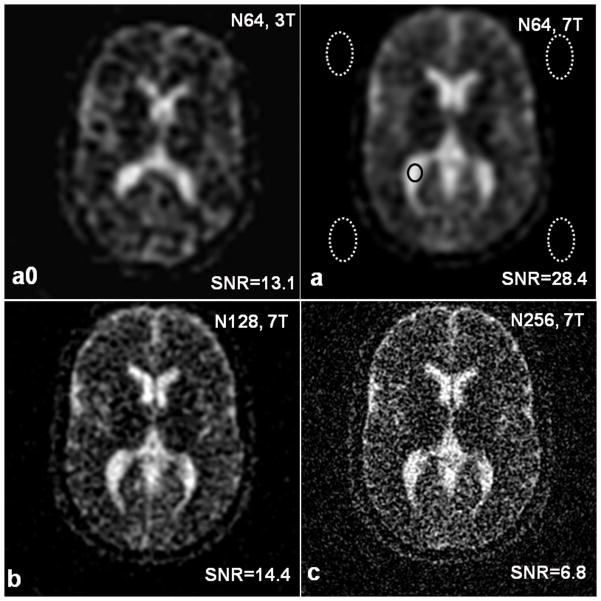
Fig. 3.
Sodium images of a healthy human brain at 7T at nominal resolutions of (a) 3.44mm (N64), (b) 1.72mm (N128) and (c) 0.86mm (N256), compared with the image at 3T (a0). The ellipses in (a) are the regions for SNR measurement (one signal and four noise-only regions).SNR was increased by a factor of 2.2 from 3T to 7T (a0, a). As expected, the higher resolutions showed brain structures sharper than the low resolution.

