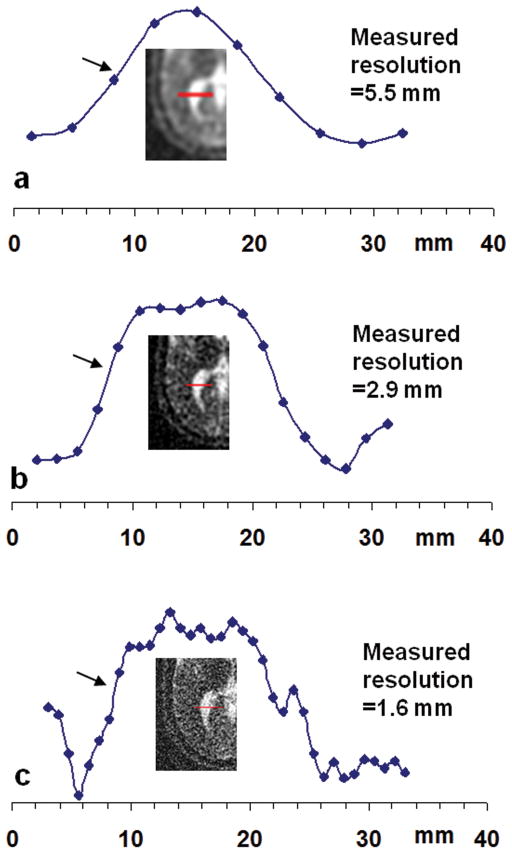
Fig. 4.
Resolution measurement on the sodium images of a healthy human brain at 7T at nominal resolutions of (a) 3.44mm, (b) 1.72mm, and (c) 0.86mm. The plotted intensity profiles in arbitrary unit were from the pixels (dots) on the line segments across the right lateral ventricle as shown in the inset images. The resolutions were measured on the left side (arrows) and were 5.5, 2.9 and 1.6 mm, respectively, 60–86 % larger than their nominal values.

