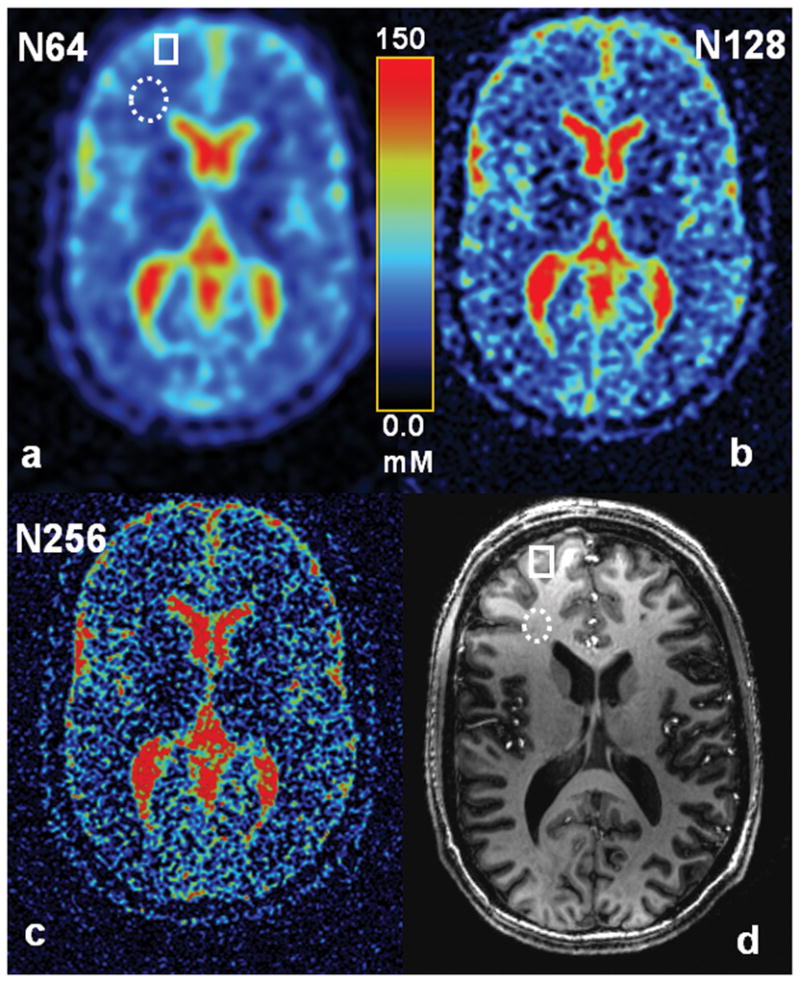
Fig. 5.

Tissue sodium concentration (TSC) maps of a healthy human brain at 7T at measured resolutions of (a) 5.5 mm (N64), (b) 2.9 mm (N128), and (c) 1.6 mm (N256). MPRAGE T1-weighted proton image at 7T (d) was used for identifying the white (dashed ellipses) and gray (solid rectangle) matter regions of interest in the sodium images as shown in (a, d). Two single-tuned coils (1H, 23Na) were employed in this examination.
