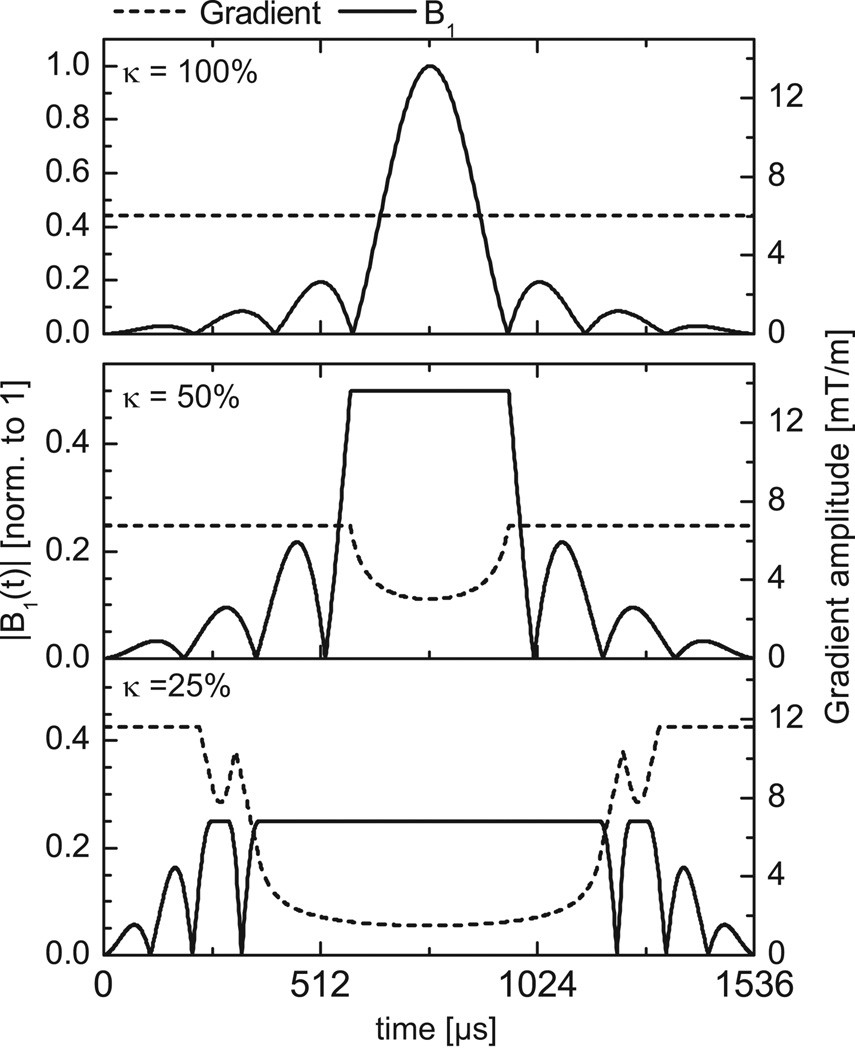
Figure 1.
Top: Initial gradient waveform and RF excitation pulse shape. Middle and Bottom: Gradient waveforms and RF excitation pulse shapes after applying VERSE with maximum RF amplitude reduced to κEXC=50% (middle) or κEXC=25% (bottom) of the initial RF pulse maximum amplitude. Note that the left vertical scale was reduced from [0–1] (top) to [0–0.5] (middle and bottom) for better visualization.

