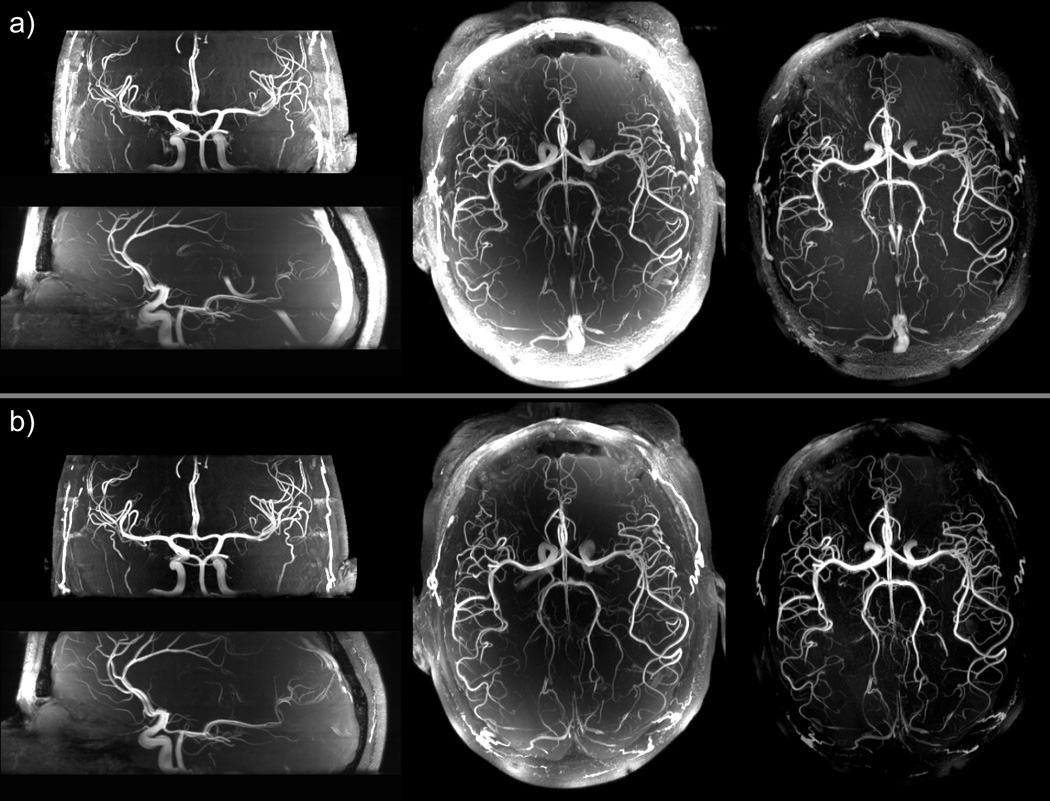
Figure 7.
Maximum intensity projection (MIP) images of multi-slab 3D TOF data sets acquired with: a) the initial TOF sequence without saturation pulse and without magnetization transfer pulses, and b) the modified TOF sequence using VERSE excitation, VERSE saturation and magnetization transfer pulses. The transversal MIP images are full projections through the 4 slabs, the sagittal and coronal MIP images are projections obtained over a 40 mm thickness. The corresponding imaging parameters are listed in Table 2. In the last column, transversal MIP images were obtained after correcting the acquired data for receive sensitivity induced signal variations. The product [B1+ × proton density] was estimated by dividing smoothed small flip angle GRE images by the AFI map. A 2D polynomial fit of the latter ratio was then used to divide TOF data before generating the MIP images.

