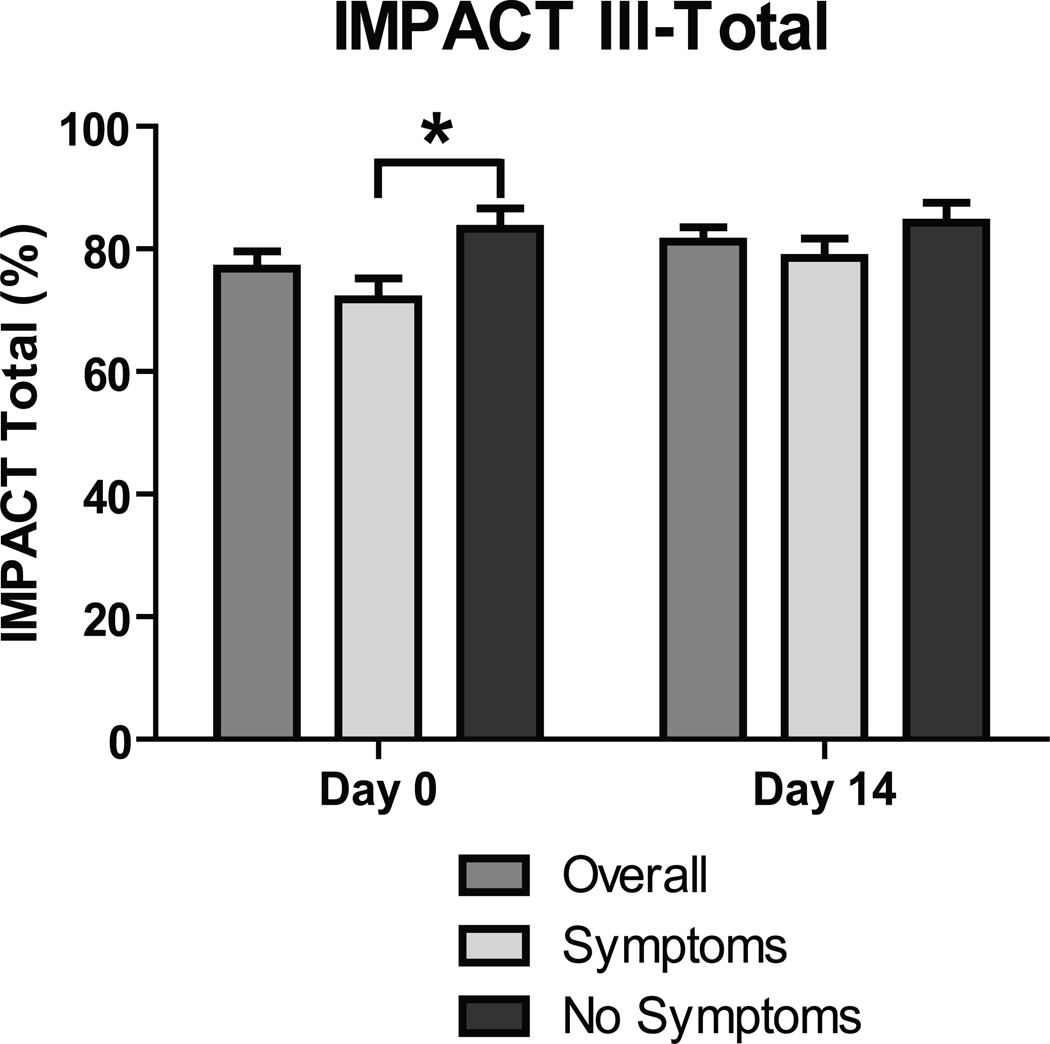
Figure 2. Quality of life pre-treatment and at 2 weeks.
IMPACT III scores converted as a percent maximum for subjects overall and broken down into those symptomatic and asymptomatic. To obtain raw IMPACT III score, multiply percent maximum by 1.75. Comparison between groups, symptomatic vs. asymptomatic: * p<0.05.

