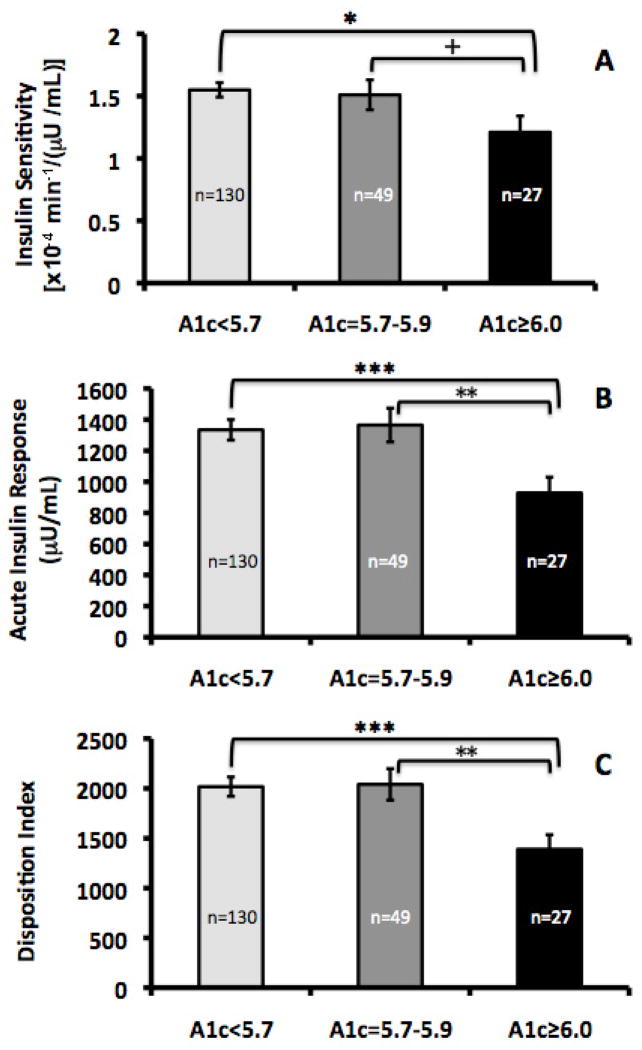
Figure 2.
A) Insulin sensitivity, B) Acute Insulin Response, C) Disposition Index. ANCOVAs were performed on log-transformed data and results were then back-transformed for figure presentation. SI and DI estimated marginal means (EMM) are shown ± SE and are adjusted for age and total percent body fat. AIR EMM was also adjusted for SI.
*p<0.05, **p<0.01, ***p<0.001

