
Figure 1.
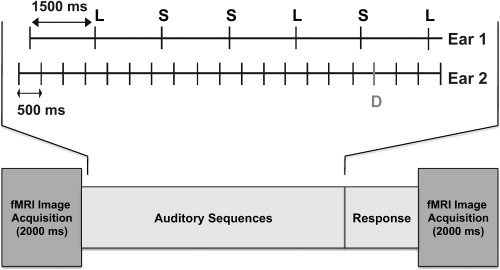
A schematic illustration of stimulus presentation in a single trial: Short (S) and long (L) sequence is shown in Ear 1; within stream SOA = 1,500 ms. An oddball sequence is shown in Ear 2; D = deviant; within stream SOA = 500 ms. Timing between streams sample: A duration tone in Ear 1 was followed by three standard tones in Ear 2 (SOA = 250 ms), which were then followed by a duration tone in Ear 1 (SOA = 250 ms) and a deviant in Ear 2 (SOA = 250 ms). The deviant in the oddball stream could have appeared at 250, 750, or 1,250 ms following a duration stimulus. In the fMRI session, stimuli were presented in the “quiet” time between image acquisitions.