
Figure 2.
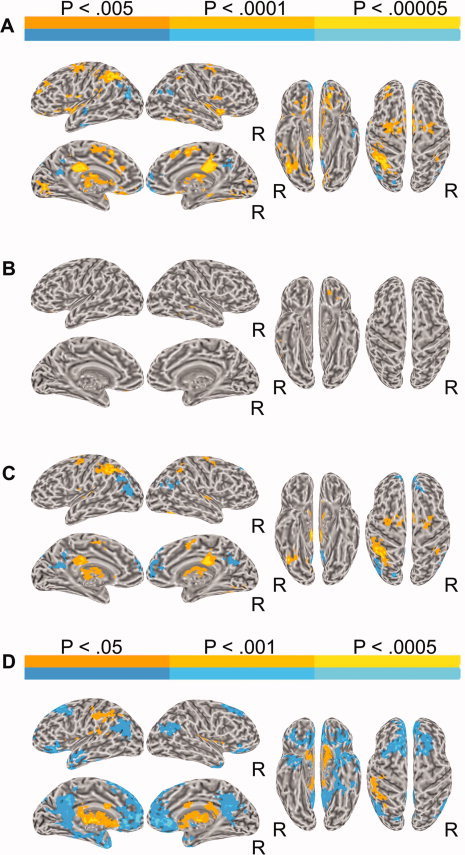
(A) Brain activation for the contrast between deviants and standards. In all figures, left and right lateral and medial views of the inflated brain surface are shown in the left half of the figure, ventral and dorsal views in the right half. The color scale indicates voxelwise probability values. R = right. (B) Brain activation for the contrast between undetected deviants and standards. (C) Brain activation for the contrast between detected deviants and standards. (D) Brain activation for the contrast between detected and undetected deviants.