
Figure 3.
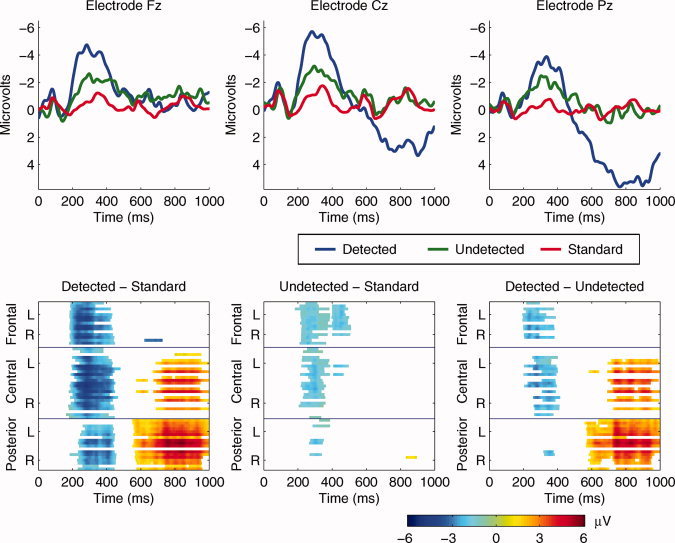
(Top) Group average ERP waveforms superimposed for the standard stimuli, detected deviants, and undetected deviants at frontal (Fz), central (Cz), and parietal (Pz) electrode cites. (Bottom) Spatio‐temporal statistical maps from 60 electrodes: Grand average difference scores of detected deviants minus standards, undetected deviants minus standards, and detected deviants minus undetected deviants at each electrode following pointwise analysis and correction. The y‐axis represents the frontal, central, and posterior electrodes. Each group of electrodes (frontal, central, posterior) is arranged top to bottom according to their lateral position from left (L) to right (R) with the midline electrode in the middle. The color scale represents the amplitude in μV.