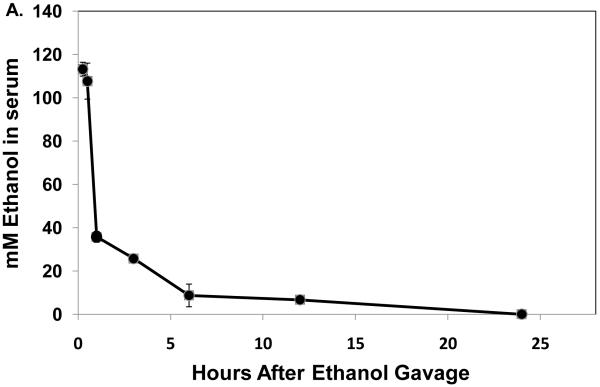
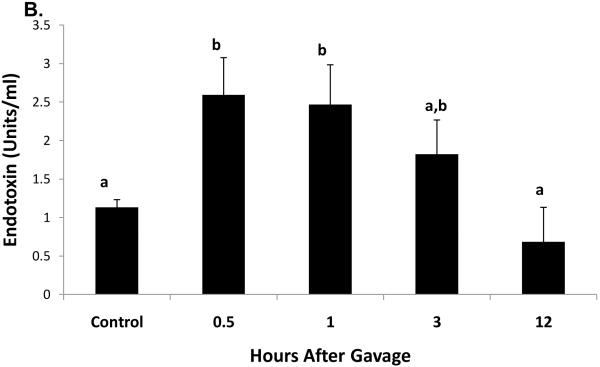
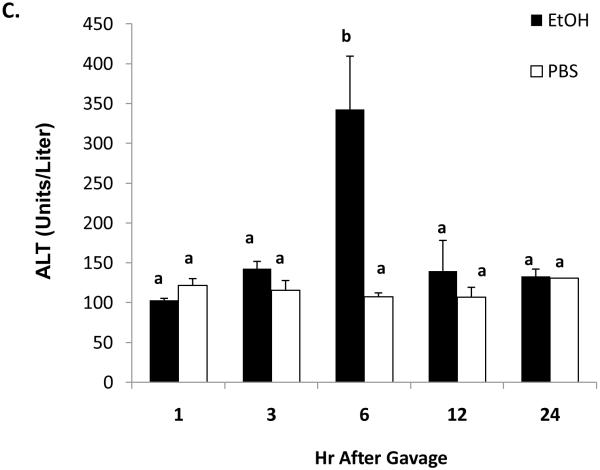
Fig 1.
Serum ethanol (panel A), serum endotoxin (panel B), and serum ALT (panel C) at the indicated times after a single standard dose of ethanol (6 grams/kg body wt) or PBS. Data presented are mean values (± SEM) from 2 to 10 animals per group per time point. Note: in Fig 1B, data from control animals (n=5) were compiled from sera of PBS-treated animals taken at 30 minutes and 3 hr post-gavage. Data with different letters indicate they are significantly different from each other. Data with the same letter are not significantly different.


