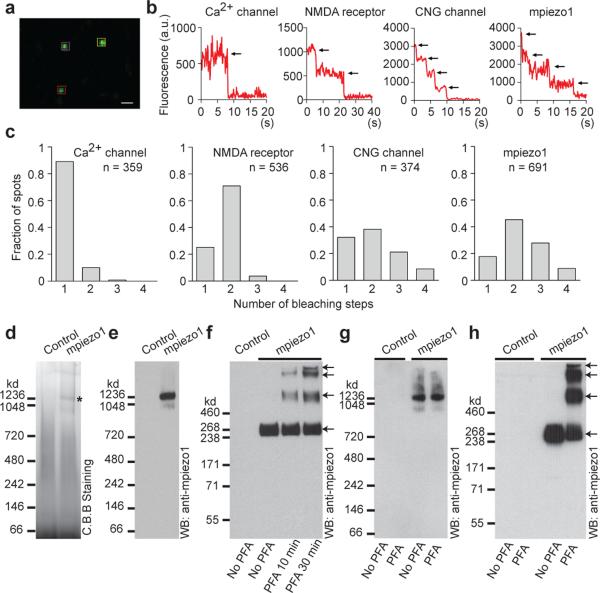
Figure 4. mpiezo1 forms tetramers.
(a) Representative image of an acquired sequence showing three selected GFP-mpiezo1 spots in the cell membrane. Levels were adjusted for clarity. Scale bar, 0.8 μm. (b) Representative traces of fluorescence intensities of indicated single GFP-fusion constructs. Black arrows indicate photo-bleaching steps. (c) Histograms of the average number of bleaching steps observed in 10 or more movies from 4 or more oocytes of single fluorescent complexes of indicated constructs. (d,e) Indicated samples purified and separated on native gels and visualized by Coomassie staining (d) or western blotting (e). Asterisk in (d) indicates a strong protein band specifically present in the mpiezo1 sample. (f) Purified mpiezo1-GST proteins treated with or without PFA with the indicated time period, separated on a denaturing gel and detected with the anti-mpiezo1 antibody. Sample purified from cells without transfection served as a negative control. (g, h) mpiezo1-GST-transfected HEK293T cells or untransfected cells treated with or without 0.25% PFA for 10 minutes. The crosslinked mpiezo1-GST proteins were purified and separated on native gel (g) or denaturing gels (h), followed by western blotting. Panels d-h are representatives of at least 3 independent experiments.

