Table 2.
Relative Binding Affinity (RBA) of 7-Thiabicyclic-7-oxide Analogs for ERα and ERβa.
| Entry | Compound | ERα | ERβ | α/β ratio |
|---|---|---|---|---|
| 1 |
 10a |
0.956 ±0.16 | 0.110 ±0.03 | 8.33 |
| 2 |
 10b |
0.074 ± 0.002 | 0.080 ± 0.015 | 0.925 |
| 3 |
 10c |
0.077 ± 0.01 | 0.071 ±0.02 | 1.08 |
| 4 |
 10d |
0.017 ±0.005 | 0.013 ±0.001 | 1.31 |
| 5 |
 10e |
0.022 ± 0 | 0.048 ± 0.005 | 0.458 |
| 6 |
 11a |
8.11 ±1.8 | 0.348 ± 0.01 | 23.3 |
| 7 |
 11b |
0.741 ±0.18 | 0.091 ± 0.02 | 8.14 |
| 8 |
 11c |
3.53 ± 0.45 | 0.138 ±0.04 | 25.6 |
| 9 |
 11d |
2.49 ± 0.31 | 0.227 ± 0.03 | 11.0 |
| 10 |
 11e |
2.21 ± 0.60 | 0.070 ± 0.02 | 31.6 |
| 11 |
 11f |
2.18 ± 0.65 | 0.080 ± 0.02 | 27.2 |
| 12 |
 11g |
2.13 ±0.36 | 0.083 ± 0.02 | 25.7 |
| 13 |
 11h |
3.37 ± 0.22 | 0.297 ± 0.08 | 11.3 |
| 14 |
 11i |
1.30 ±0.37 | 0.088 ± 0.021 | 14.8 |
| 15 |
 11j |
0.998 ± 0.22 | 0.180 ±0.05 | 5.54 |
| 16 |
 11k |
2.21 ± 0.48 | 0.812 ±0.06 | 2.72 |
| 17 |
 11l |
0.016 ±0.002 | 0.014 ±0.004 | 1.14 |
| 18 |
 12a |
3.49 ± 0.47 | 0.014 ±0.004 | 249 |
| 19 |
 12b |
0.310 ±0.05 | 0.021 ± 0.006 | 14.8 |
| 20 |
 12c |
2.48 ±0.13 | 0.010 ±0.003 | 248 |
| 21 |
 12d |
1.18±0.18 | 0.022 ± 0.005 | 53.6 |
| 22 |
 12e |
0.516 ±0.14 | 0.014 ±0.004 | 36.8 |
| 23 |
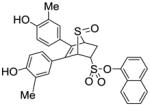 12f |
0.236 ± 0.07 | 0.019 ±0 | 12.4 |
| 24 |
 12g |
0.109 ±0.003 | 0.009 ± 0.001 | 12.1 |
| 25 |
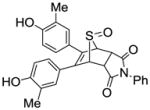 12h |
0.009 ± 0.002 | 0.007 ± 0.001 | 1.28 |
| 26 |
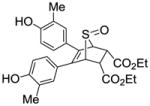 12i |
0.026 ± 0.008 | 0.019 ±0.005 | 1.37 |
| 27 |
 13 |
0.005 ± 0.001 | 0.008 ± 0.001 | 0.62 |
| 28 |
 14 |
0.005 ± 0.001 | 0.011 ±0.001 | 0.45 |
| 29 |
 15 |
0.035 ± 0.009 | 0.055 ± 0.001 | 0.64 |
| 30 |
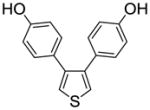 1a |
0.572 ± 0.12 | 1.69 ± 0.45 | 0.338 |
| 31 |
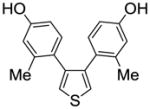 1b |
2.16 ±0.54 | 4.86 ± 1.3 | 0.444 |
| 32 |
 1c |
0.793 ± 0.05 | 0.306 ± 0.01 | 2.59 |
Relative binding affinity (RBA) values are determined by competitive radiometric binding assays and are expressed as IC50estradiol/IC50compound × 100 ± the range or standard deviation (RBA, estradiol = 100%). In these assays, the Kd for estradiol is 0.2 nM on ERα and 0.5 nM on ERβ. For details, see the Experimental Section.
