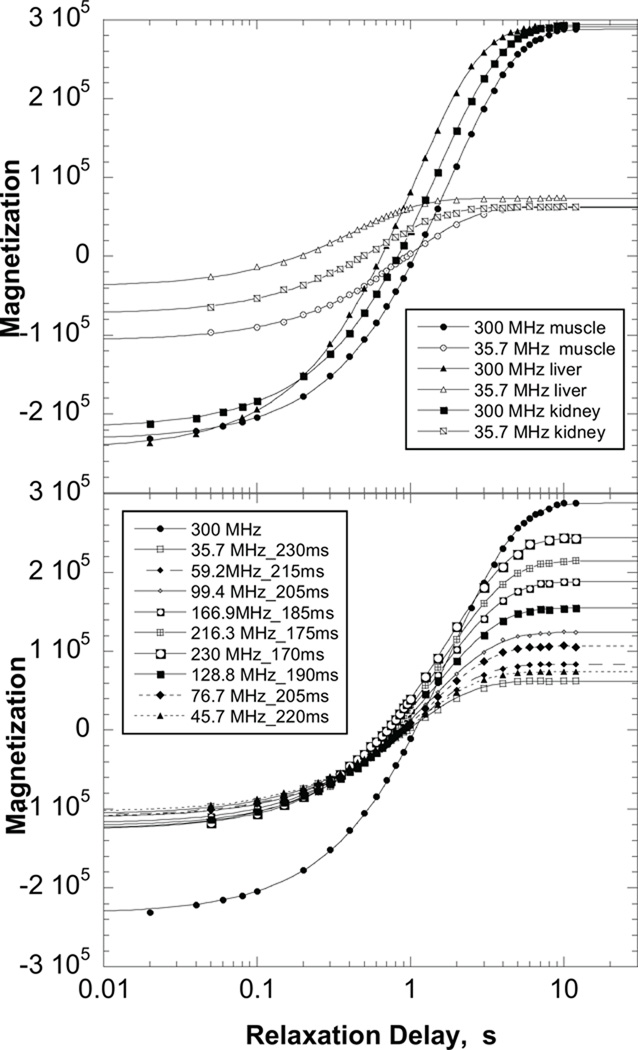
Figure 1.
Top: Representative magnetization recovery curves for muscle, liver, and kidney shown for relaxation fields of 300 MHz and 35.7 MHz as a function of relaxation delay. Bottom: representative magnetization recovery curves for muscle tissue at each magnetic field as a function of relaxation delay.

