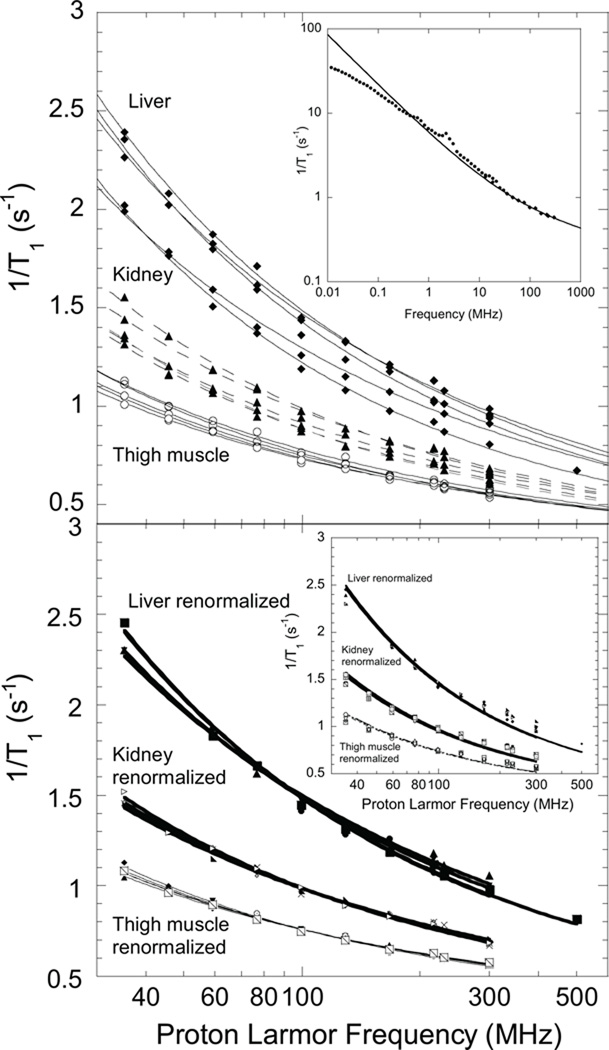
Figure 2.
Top: 1H nuclear spin-lattice-relaxation-rate constants as a function of magnetic field strength shown as the proton Larmor frequency for five samples of excised rat muscle, kidney, and liver at ambient laboratory temperature( 295±2 K). Solid lines are least squares fits to Eqn. 2. The inset shows the magnetic field dependence for a muscle sample from 0.01 MHz to 300 MHz; the solid line was computed with Eq. 2 and the parameters A= 6.4×10⁴ s−1.6 and B = 2.6×10⁻⁸ s−2. Bottom: Renormalized tissue data; parameters summarized in Table I. The inset shows fits of tissue data to Eq. 1.

