
Figure 6.
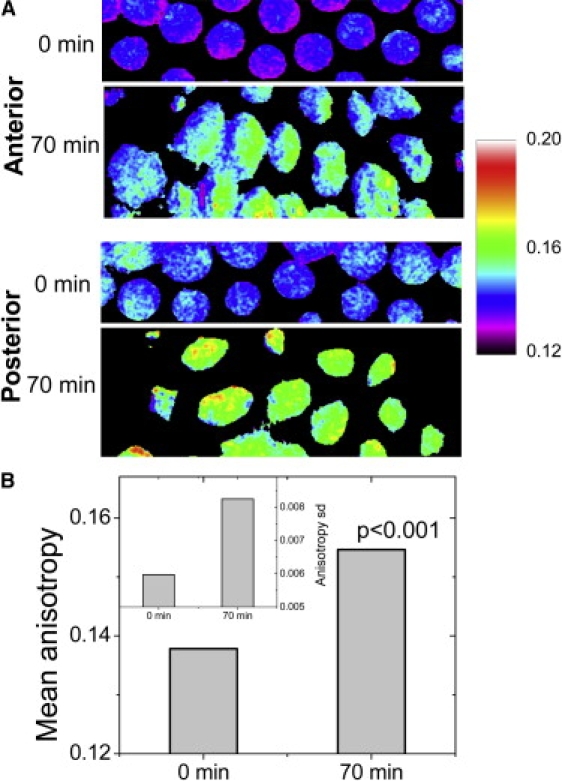
Evolution of rigidity maps of the chromatin in the Drosophila embryo using fluorescence anisotropy. (A) Color-coded anisotropy maps are shown for typical nuclei in the anterior and posterior of the embryo at 0 min (defined at 5 min after the completion of the 13th mitotic cycle), and at 70 min when nuclei of higher and more variegated chromatin rigidity states have emerged. The bar to the right shows anisotropy values corresponding to specific colors. (B) The anisotropy rise at the indicated time points are computed at each pixel and the plot shows the rise in the mean anisotropy (p < 0.001). (Inset) Corresponding small changes in standard deviation of anisotropy over pixels.