
Figure 2.
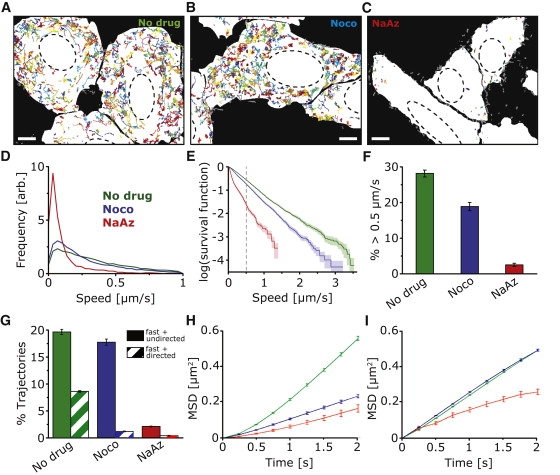
Quantitative analysis of PV motion. (A–C) Color overlays of all PV trajectories identified in representative movies of untreated, nocodazole-treated (Noco), and sodium azide-treated (NaAz) cells (see also Movie S1, Movie S3, and Movie S4). The corresponding still frames of the movies are shown in Fig. 1, A–C. The white cell maps indicate the interior of the cells as identified by confocal images of the plasma membrane marker R18, and the dashed lines represent the outlines of the nuclei. Trajectories not contained entirely within the white cell maps are rendered in gray and were excluded from further analysis. All movies were 400–500 frames (100–125 s) long. Scale bars in A–C = 5 μm; ∼40,000 trajectories from ∼150 cells and 61 movies were used for the analysis. (D) PV peak speed distributions in untreated (green), nocodazole-treated (blue), and NaAz-treated (red) cells. The speeds shown here and subsequently are calculated from the viral trajectories after four-point moving average. (E) Survival function plot of the observed peak speed distribution. The survival function plot shows along the y axis the fraction of trajectories with peak speed higher than the corresponding threshold value given in the x axis. (F) Percentage of trajectories with peak speeds above 0.5 μm/s. (G) Percentage of trajectories that are categorized as “fast and directed” and “fast and undirected” as defined in the text. Error bars = SE. (H) Mean-square displacement (MSD) analysis of the fast and directed subgroup and (I) of the fast and undirected subgroup for untreated (green), nocodazole (blue), and NaAz (red)-treated cells. Shown in the plots is the average MSD of all trajectories within the indicated subgroup.