
Figure 3.
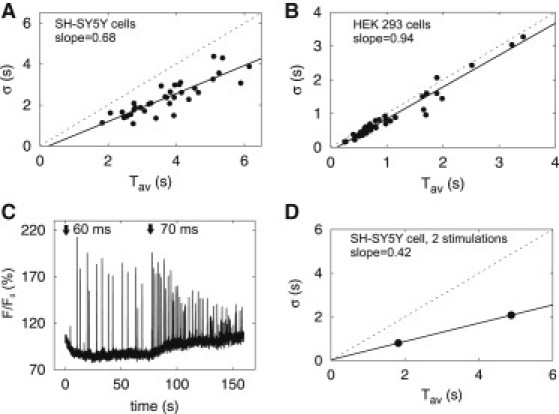
Relation of standard deviation (σ) and average (Tav) of IPI is linear with 0 s intercept and slope smaller than one. (A and B) From IPI sequences similar to those shown in Fig. 1, σ and Tav were calculated. Dashed lines mark the identity function, and solid lines are linear fits with the indicated slope. Each point is from a single puff site in either a SH-SY5Y cell (A) or a HEK 293 cell (B). The intercepts with the Tav axis are 0.26 s (A) and 0.11 s (B). (C) Fluorescence at a single puff site in a SH-SY5Y cell was recorded during stimulation with two successive ultraviolet-flashes at the indicated times and with the indicated flash durations. Because the basal fluorescence intensity increased after the second stimulus, running averages were subtracted for statistical analysis (see Methods). (D) Individual σ-Tav relation from the data shown in C, which provides two data points with σ and Tav for the puff site.