
Figure 2.
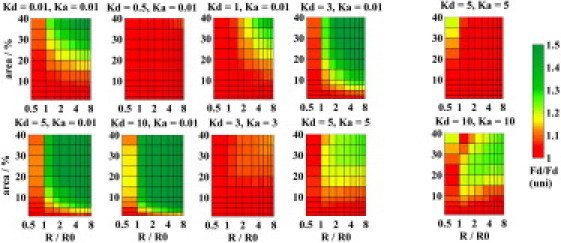
Resolution of FRET represented by the ratio of the intensity of donors (FD) to the intensity of donors when D/A pairs are distributed uniformly in the bilayer (FD(uni)) as a function of the domain area and the relative domain radius. The donor lifetime was 6 ns in the Lo and Ld phase (left) or it was 6 ns in the Ld and 8 ns Lo phase (right). For [KD = 0.01, KA = 0.01], [KD = 3, KA = 3], [KD = 5, KA = 5], and [KD = 10, KA = 10], the ratio FD(uni)/FD is displayed instead. Values >1.5 are displayed with the same color as the limiting value.