
Figure 3.
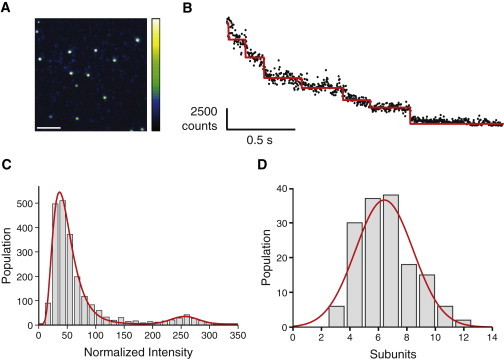
Oligomer stoichiometry. (A) Single frame (5 ms) from a droplet interface bilayer acquired 30 min after injection of labeled protein. Bright oligomers and monomers are resolved as separate fluorescent spots (scale bar 5 μm). (B) An example oligomer photobleaching trajectory. The intensity is plotted (black circles) with detected steps overlaid in red. Steps were detected automatically as jumps in intensity greater than three standard deviations above the average noise in the unfiltered data. Seven stepwise decreases in fluorescence intensity are detected corresponding to complete photobleaching of a heptameric oligomer. (C) A normalized (see the Supporting Material) fluorescent spot intensity histogram showing two intensity distributions. The histogram was fitted with a sum of log-normal and normal probability density functions by least-squares minimization. The lower intensity peak (monomers) has a mean value of 36.4 ± 0.3, and the higher intensity peak (heptamers) has a mean value of 256.1 ± 5.9, corresponding to 7.0 ± 1.2 multiples of the monomer intensity. (D) Histogram of oligomer stoichiometries. This distribution is fitted with a Gaussian with a mean value of 6.4 ± 0.2 steps.