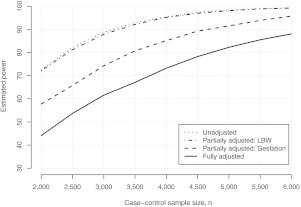
Fig. 1.
Estimated power curves for detecting θx = 1.3 under a balanced case–control study, as a function of the case–control sample size n = n0 + n1. Each curve corresponds to a model that forms the basis for the power calculation (Sections 2.2 and 3.1). Estimates were obtained using the algorithm in the supplementary material (available at Biostatistics online) with R = 10000.

