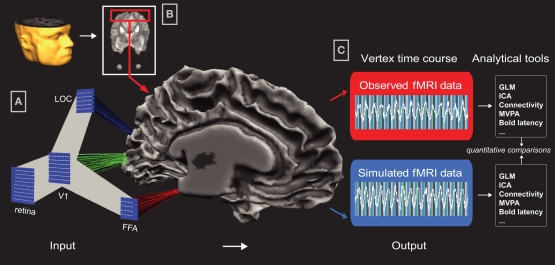
Figure 2.
Data Integration in Common Brain Space. Input: (A) Visualization of Common Brain Space (CBS) in Neurolator: Each computational unit of a neural network layer is separately connected to a topographically corresponding location on the cortical sheet via a Network−Brain Link (NBL). In this example, model layers V1, LOC, and FFA are connected to the corresponding brain regions V1, LOC, and FFA on a mesh reconstruction of an individual's gray-white matter boundary. For this participant, V1, LOC, and FFA were localized using standard retinotopy and related fMRI Region-of-Interest mapping techniques. By connecting a running neural network, activity in the connected layers is projected to the cortical sheet via the NBLs, creating spatially specific timecourses. (B) In Neurolator, functional MRI data can be projected on the cortical mesh, similar to the standard functional-anatomical data co-registration applied in fMRI analyses. Output: (C) Depending on display mode, cortical patches (i.e., vertices) either represent the empirical or the simulated fMRI data. Since the observed and simulated datasets are in the same anatomical space, identical fMRI analyses tools can be used to analyze observed and simulated timeseries.

