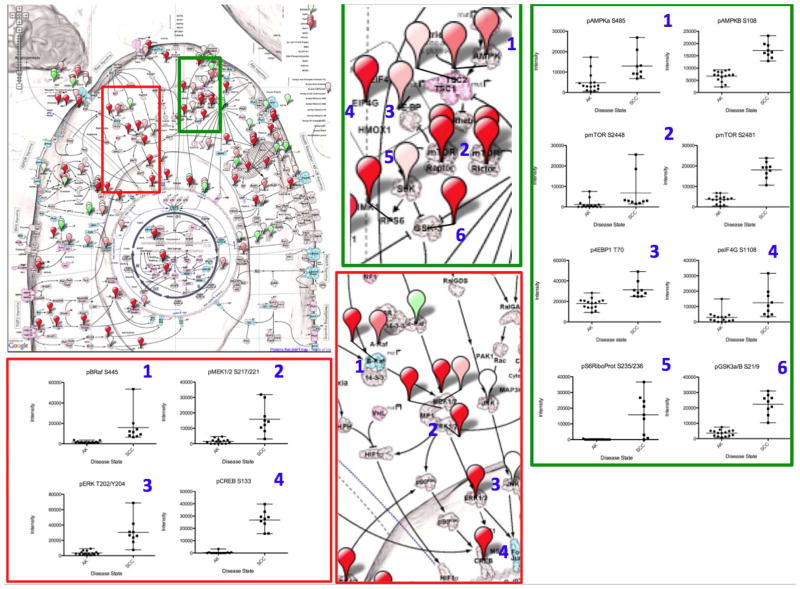
Figure 4.
Protein Pathway Activation Map of SCC. A Cancer Landscape (CScape) Protein Pathway Activation Map (4 Top left) is shown using population averages of RPMA data from patients with AK and SCC. Higher fold differences in the SCC group are shown in increasing shades of red while higher fold differences in signaling in the AK group are shown in green. Each balloon pin is placed over the protein measured. Magnified views of the AMPK-mTOR pathway (green box, middle top) and RAS-RAF-ERK pathway (red box, middle bottom) are shown to reveal pathway detail. Linked pathway members from each pathway are numbered and the individual protein data are plotted as scatter plots for the statistically significant endpoints.

