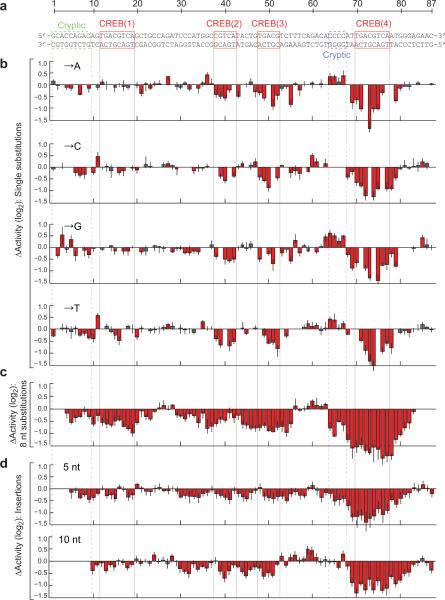
Figure 2. Single-hit scanning mutagenesis of the cAMP-responsive enhancer.
(a) The CRE sequence with known and putative transcription factor binding sites indicated. (b) Changes in induced activity due to single nucleotide substitutions. Each bar shows the log-ratio of the median variant and wild-type activity estimates. (c) Changes in induced activity due to 8 consecutive substitutions. The plot shows the medians of three different types of substitutions, see Supplementary Fig. 3. Each bar is located at the fourth nucleotide in the corresponding 8 nt substitution. (d) Changes in induced activity due to 5 nt (top) and 10 nt (bottom) insertions. The plots show the means of two different insertions, see Supplementary Fig. 4. Each bar is located one nucleotide to the right of the insertion. Error bars show the first and third quartile. Red indicates a significant change from wild-type (Mann-Whitney U-test, 5% FDR). Numerical values are provided in Supplementary Table 3.

