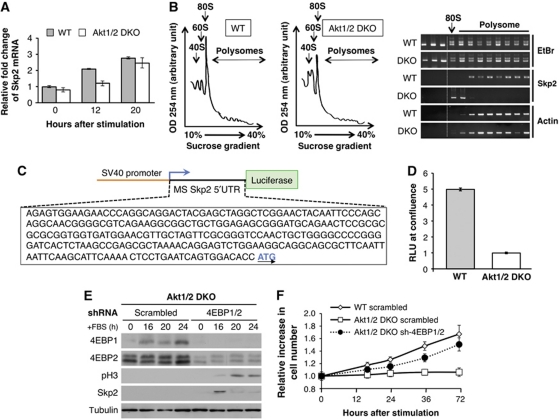
Figure 4.
Skp2 mRNA translation is induced in WT (LT) MEFs during exit from contact inhibition, but not in Akt1/2 DKO (LT) MEFs due to the inhibition by 4E-BPs. (A) RNA isolated from WT and Akt1/2 DKO cells at 0, 12, and 20 h after FBS stimulation were analysed by quantitative RT–PCR with primers for Skp2 and β-actin. Results are expressed relative to β-actin and represent the average ±s.e. of three independent experiments. (B) (Left panels) Representative absorption profiles of ribosomes from WT and Akt1/2 DKO cells treated for 16 h with 20% FBS. 40S and 60S denote the corresponding ribosomal subunits and 80S the monosome. (Right panel) RNA was visualized by ethidium bromide (EtBr). Distribution of Skp2 and β-actin mRNAs was determined by semi-quantitative RT–PCR (representative results of four independent experiments). (C) Schematic of 5′ UTR of mouse Skp2-Luciferase reporter construct. (D) WT and Akt1/2 DKO MEFs were co-transfected with Renilla and pGL3 Skp2 5′ UTR luciferase vector as described in Materials and methods. The cells were then grown to confluence and analysed with the Dual Luciferase Reporter Assay system. Relative light units (RLUs) are depicted in the graph. Results are expressed relative to Renilla luciferase luminescence and represent the average±s.e. of four independent experiments. (E) Akt1/2 DKO (LT) MEFs stably expressing a scrambled or 4EBP1 and 4EBP2-specific shRNA (sh-4EBP1/2) were grown to confluency. Two days post confluency, medium was replaced with medium containing 20% FBS and cell lysates of Akt1/2 DKO scrambled control and sh-4EBP1/2 MEFs were prepared at 0, 16, 20, and 24 h post FBS stimulation and subjected to immunoblotting with anti-4EBP1, 4EBP2, phospho-H3, Skp2, and tubulin antibodies. (F) In a parallel experiment, cell number was measured at 0, 16, 24, 36, and 72 h after FBS stimulation. The relative increase in cell number (compared with time 0) is depicted. Results represent the average ±s.e. of three independent experiments.

