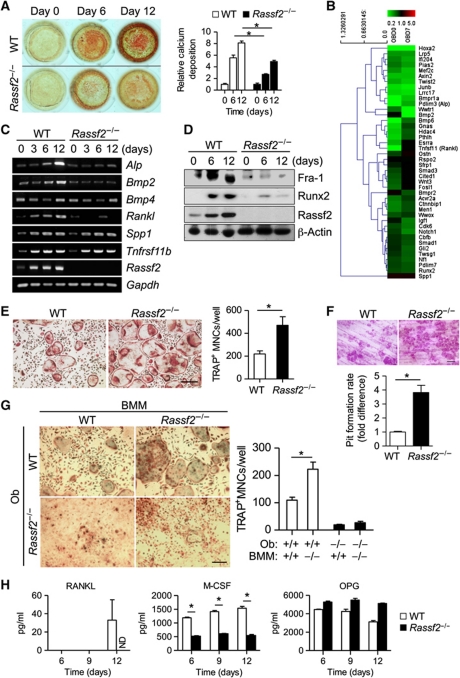
Figure 3.
RASSF2 promotes osteoblast differentiation and inhibits osteoclast differentiation. (A) Calcium deposition during differentiation of osteoblasts from calvarial osteoblast precursors isolated from Rassf2−/− and WT littermates. Representative alizarin red S staining images of cultures on days 0, 6, and 12 are shown on the left, and quantitative data appear on the right (the figures are expressed relative to the values for WT cells on day 0, and are mean values±s.d.; n=4, *P<0.01). (B) Global gene expression profiling of WT and Rassf2−/− osteoblasts. Expression of marker genes for osteoblast differentiation (biological process GO 0001649) was analysed in Rassf2−/− osteoblast precursors both before (day 0, OBD0) and during differentiation into osteoblasts (day 7, OBD7), and compared with that of WT cells. Data are shown relative to expression levels in the latter type of cells. (C, D) RT–PCR analysis of the expression of osteoblast differentiation marker genes and Rassf2 (C), and IB analysis of osteoblast differentiation marker proteins and Rassf2 (D), during osteoblastogenesis in osteogenic medium of calvarial osteoblast precursors isolated from Rassf2−/− and WT mice. Gapdh and β-actin were used as controls in either analysis. (E) Osteoclast differentiation from BMMs prepared from Rassf2−/− and WT littermates. TRAP-positive multinucleated osteoclasts (TRAP+ MNCs) after culture for 4 days in the presence of RANKL and M-CSF are shown on the left (scale bar, 100 μm), and the numbers of TRAP+ MNCs at this time are shown on the right; data are mean values±s.d. (n=4, *P<0.01). (F) Bone pit formation assay. After differentiation of BMMs into osteoclasts on dentine slices, the slices were stained with haematoxylin and staining was quantitated using image analysis software. Representative images are shown in the upper panel (scale bar, 100 μm). Quantitative data are mean values±s.d. (n=3, *P<0.01). (G) Osteoclast differentiation from WT or Rassf2−/− BMMs co-cultured with WT or Rassf2−/− osteoblasts (Ob). TRAP-positive osteoclasts after co-culture for 9 days are shown in the left panels (scale bar, 100 μm), and the numbers of TRAP+ MNCs appear in the right panel; data are mean values±s.d. (n=4, *P<0.01). (H) After osteoblast differentiation in osteogenic media for the indicated times, RANKL, M-CSF, and OPG levels in culture media were measured by ELISA; the data are mean values±s.d. (n=3, *P<0.01). ND; not detected.

