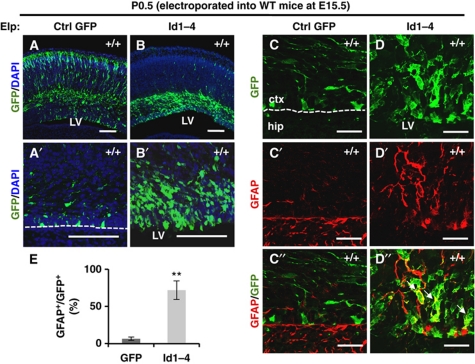
Figure 5.
Id1–Id4 overexpression mimicked the Rp58 KO phenotype in the promotion of astrogenesis. (A–D″) Representative images showing coronal sections of WT brains electroporated at E15.5 with Gfp expression vector (A, A′, C–C″) or co-electroporated with Gfp, Id1, Id2, Id3, and Id4 expression vectors (B, B′, D–D″) fixed at P0.5 and stained with anti-GFP (green) and Topro3 (blue, nuclear stain) (A–B′), or anti-GFP (green, C, D, C″, D″) and anti-GFAP (red) (C′–D″). Scale bars: 100 μm (A–B′), 25 μm (C–D″). The dotted line in (A′, C) indicates the edge of the VZ. The arrows in (D″) indicate the double-stained cells. (E) Quantification of the ratio of GFAP-positive cells to GFP-positive cells in (C″, D″) (t-test: **P<0.01). Data were represented as mean±s.d. (n=4).

