Figure 1.
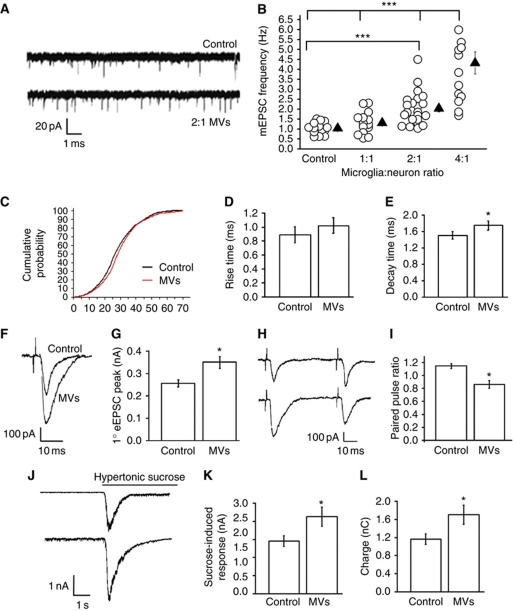
Effect of MVs on neurotransmission in hippocampal cultures. (A) Representative traces of mEPSCs from control neurons and neurons exposed to MVs. (B) Changes of mEPSC frequency evoked by MVs in a microglia-to-neuron ratio of 1:1 (MVs concentration=1.2 μg/ml), 2:1 (MVs concentration=2.38 μg/ml), and 4:1 (MVs concentration=4.76 μg/ml); N=3; one-way ANOVA followed by Dunn's method, P<0.001. (C) Cumulative distribution of mEPSC amplitude from control and MV-treated neurons; n=15 controls; n=12 MV-treated neurons; t-test followed by Mann–Whitney, P=0.054. (D, E) Rise time (D), t-test followed by Mann–Whitney rank-sum test, P=0.071 and decay time (E), n=10 controls; n=15 MV-treated neurons; test followed by Mann–Whitney, P=0.006 of mEPSCs from control and MV-treated neurons. (F, G) Examples of stimulus-evoked EPSCs in control and MV-treated paired mouse neurons (F) and corresponding mean amplitude (G); t-test P=0.001, N=3, 11 versus 10 pairs, respectively. (H, I) Representative traces of short-term plasticity in paired mouse neurons (H) and quantitative analysis of paired-pulse ratio (I); n=10 pairs per conditions, N=3, t-test followed by Mann–Whitney rank-sum test, P=<0.001. (J) Representative sucrose-evoked responses from control and MV-treated neurons. (K, L) Mean amplitude (nA) and total charge (pC) of sucrose-evoked responses; N=4, n=16 Ctr; n=24 MV-treated cells; current (nA), t-test followed by Mann–Whitney rank-sum test, P=0.025; charge transferred (nC), P=0.042.

