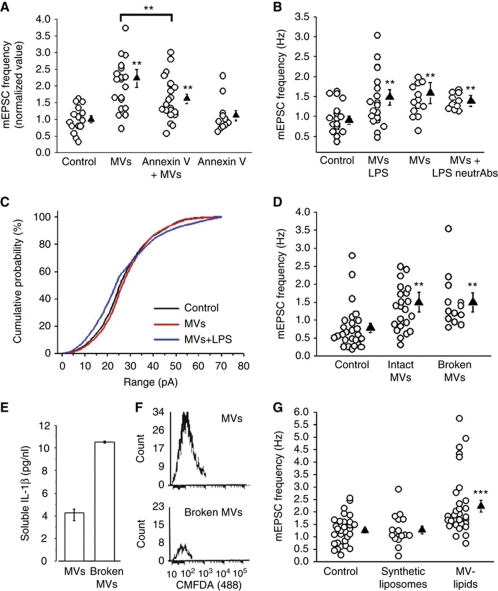
Figure 3.
Surface components of MVs stimulate of exocytosis. (A) Normalized mEPSC frequency of control neurons and neurons exposed to MVs pretreated with annexin-V; N=3, one-way ANOVA followed by Fisher's LSD methods, P<0.001. (B) mEPSC frequency of control neurons and neurons exposed to MVs derived from resting or LPS-primed microglia with or without TNF-α and IL-1β neutralizing Abs; N=3, one-way ANOVA followed by Dunn's test, P=0.003, LPS-MV-treated versus LPS-MVs-treated+neutrAb t-test, P=0.439. (C) Cumulative distribution of mEPSC amplitudes as in (B). (D) mEPSC frequency from control neurons, neurons exposed to intact or empty N9-MVs, broken by freeze and thaw; N=3, one-way ANOVA followed by Dunn's test, P=0.002. (E) MVs shed from LPS-primed N9 in saline were subjected or not to freeze and thaw. The histogram shows the concentration of IL-1β detected by ELISA in the saline containing intact MVs or broken MVs. (F) Flow cytometry plots for CMFDA of intact and broken MVs. (G) Rate of mEPSCs recorded from control neurons and neurons exposed to either artificial liposomes or native lipids from MVs; N=3, one-way ANOVA followed by Dunn's methods, P=0.002.

