Figure 4.
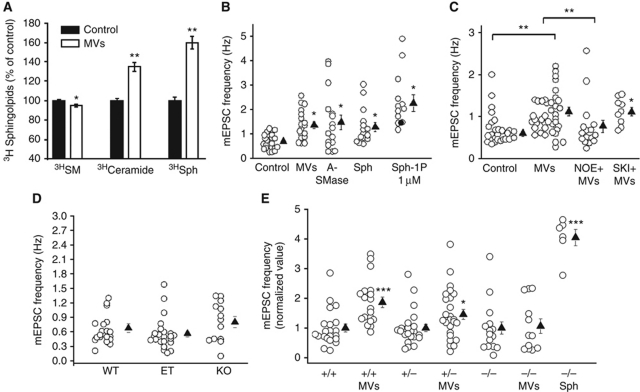
MVs stimulate sphingolipid synthesis in neurons. (A) A-SMase activity of MVs and of donor N9 cells. Values were normalized to protein concentration of equivalent amounts of MVs and N9. Cells were pulsed 1 h with [Sph-3H]SM followed by 1 h chase with or without MVs. Cell lipids were extracted and analysed as described in Supplementary data. Data are expressed as % of control. (B) Neurons were exposed to bacterial A-SMase (2 U), Sph (1 μM) or S-1P (1 μM) for 30 min, washed and mEPSCs were recorded for the subsequent 45 min. The graph shows mEPSC frequency under above conditions; N=3 for A-SMase and Sph, N=2 for S-1P; one-way ANOVA followed by Fisher's methods, P=0.014. (C) Rate of mEPSCs of control and MV-treated neurons with or without NOE and SKI-1; N=3; Ctr versus MVs treated, one-way ANOVA followed by Fisher's methods, P<0.001. (D) Rate of mEPSCs of hippocampal neurons established from WT, heterozygous or A-SMase KO mice; N=3, Kruskal–Wallis one-way ANOVA on ranks, P=0.085. (E) mEPSC frequency (normalized data) of WT, heterozygous and KO A-SMase neurons exposed or not to MVs produced by primary microglia or Sph (1 μM); N=3, +/+A-SMase versus +/+A-SMase+MVs: t-test followed by Mann–Whitney rank-sum test, P<0.001; +/−A-SMase versus +/−A-SMase +MVs t-test followed by Mann—Whitney, P=0.026; −/−A-SMase versus −/−A-SMase +MVs: t-test, P=0.981.

