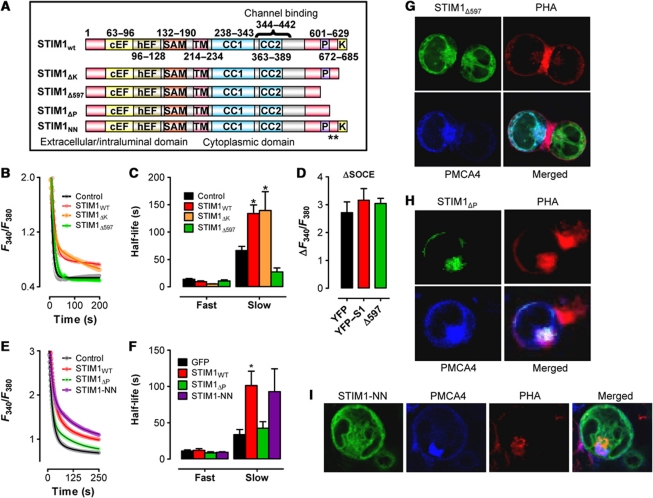
Figure 4.
Analysis of STIM1-mediated control of PMCA activation. (A) Schematic of the STIM1 constructs used; ** indicates I644N/P645N mutation. (B) Jurkat T cells were transfected as indicated 48 h before loading with Fura-2 and depleting ER Ca2+ stores with Tg (2 μM) in the absence of extracellular Ca2+. Subsequent elevation of [Ca2+]e to 1 mM led to elevated [Ca2+]c; upon reaching its peak, [Ca2+]e was again removed to monitor [Ca2+]c clearance. Note that only the last part of each curve is depicted due to space considerations. [Ca2+]c clearance rates were analysed by two-phase, non-linear regression analysis. Symbols represent individual data points while the solid lines are interpolated from one-phase, non-linear regression analysis (YFP, R2=0.85, n=5; STIM1wt, R2=0.81, n=8; STIM1ΔK, R2=0.92, n=3; STIM1Δ597, R2=0.91, n=3). (C) Half-lives obtained from non-linear regression analyses performed in experiments depicted in (B) were analysed by one-way ANOVA. * denotes statistically significant difference (P<0.05). (D) The magnitude of SOCe reached for cells expressing YFP, STIM1wt or STIM1Δ597 were calculated by subtracting the basal F340/F380 from the maximum F340/F380 reached during the application of 1 mM extracellular Ca2+. (E) Jurkat T were transfected as indicated and analysed as described for panel (B). Curve fits as follows: GFP, R2=0.92, n=4; STIM1wt, R2=0.97, n=4; STIM1ΔP, R2=0.97, n=4; STIM1-NN, R2=0.97, n=4. (F) Half-lives obtained from non-linear regression analyses performed in experiments depicted in (E) were analysed by one-way ANOVA. * denotes statistically significant difference (P<0.05). (G–I) Jurkat cells were transfected with CFP–PMCA4 and STIM1Δ597 (G), STIM1ΔP (H) or STIM1-NN (I). At 48 h after transfection, cells were treated with Alexafluor594-conjugated PHA for 2 h, mounted on a cover slip and STIM1 and PHA localization was assessed.

