Figure 2.
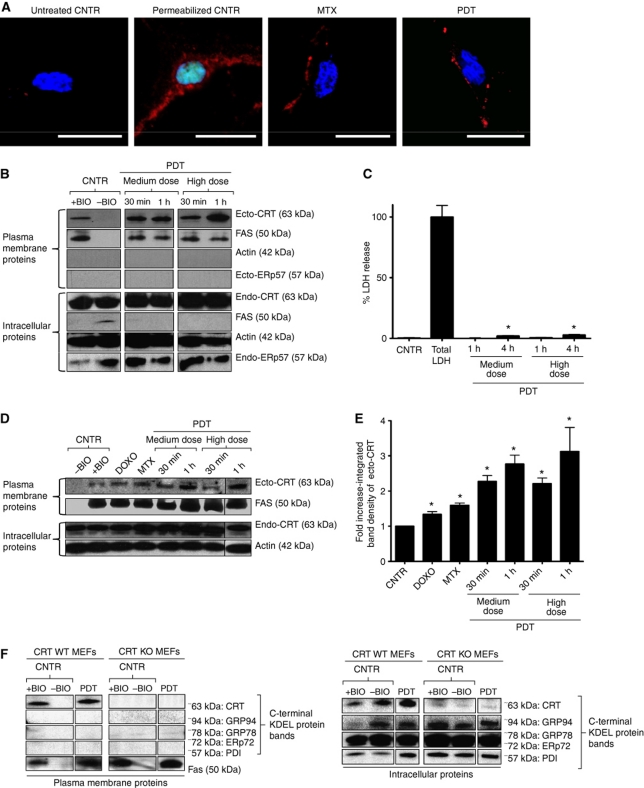
Phox-ER-stressed cancer cells expose calreticulin on the surface (ecto-CRT). (A) Immunofluorescence analysis of ecto-CRT. T24 cells were treated with MTX (1 μM for 4 h) and a high PDT dose (recovered 1 h post PDT) or left untreated (CNTR). Alternatively, some cells were saponin permeabilized. This was followed by staining with Sytox Green (exclusion dye), fixation, and immunostaining for CRT and counterstaining with DAPI; scale bar=20 μm. (B) Surface biotinylation analysis of ecto-CRT following phox-ER stress. T24 cells were treated with indicated doses of PDT. They were recovered at the indicated intervals after PDT treatment. Surface proteins were biotinylated followed by immunoblotting. In (B), (D), and (F), ‘+BIO’ indicates controls exposed to buffer with biotin and ‘−BIO’ indicates controls exposed to buffer without biotin (negative control). (C) Plasma membrane permeabilization kinetics following phox-ER stress. T24 cells were treated with PDT and the resulting conditioned media derived at the indicated times post-PDT were analysed for the presence of cytosolic LDH. Total LDH content was determined following Triton-based permeabilization of cells. Data are presented as percent LDH release; values are means of five replicate determinations±s.d. (*P<0.05, versus CNTR). (D) Phox-ER stress induces more ecto-CRT than anthracyclines. T24 cells were treated with PDT, DOXO (25 μM for 4 h), and MTX (1 μM for 4 h). They were recovered at the indicated intervals after PDT treatment. Surface proteins were biotinylated as described for (B). (E) Integrated band densitometric analysis of ecto-CRT. T24 cells were treated with DOXO (25 μM for 4 h), MTX (1 μM for 4 h), and PDT (dose and recovery time points are indicated); and surface proteins were resolved as detailed in (B). Following this, the ecto-CRT protein bands were quantified for the integrated band density via Image J software. Data have been normalized to the CNTR values. Fold change values are means of three independent determinations±s.e.m. (*P<0.05, versus CNTR). (F) Surface biotinylation analysis for KDEL sequence detection following phox-ER stress. CRT WT and KO MEFs were treated with a low PDT dose and surface biotinylated as mentioned in (B). Immunoblotting was done to detect the C-terminal KDEL sequence of various ER proteins (expected molecular weights are indicated).

