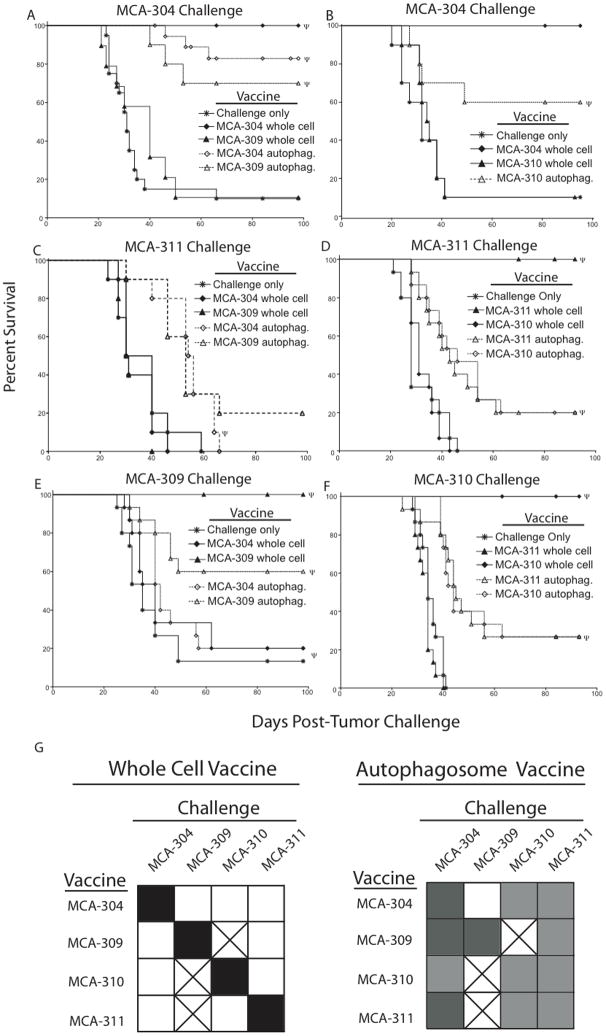
Figure 2.
Autophagosome vaccination protects mice from a challenge against non-homologous sarcomas. (A–F) Kaplan-Meier survival plots comparing protection of mice vaccinated with an irradiated whole cell sarcoma or autophagosomes derived from the sarcomas. The subcutaneous autophagosome vaccination consisted of 3×10⁶ APCs pulsed with 3×10⁶ CE of autophagosomes injected into the lower right flank of the mouse. Whole cell vaccinations were performed as above in Figure 1A. Vaccinated mice were challenged with 30,000 viable (A and B) MCA-304, (C and D) MCA-311, (E) MCA-309 or (F) MCA-310 tumors. Each survival plot represents 3 independent experiments with 5 mice per group (n=15) or (B and C) 2 independent experiments with 5 mice per group (n=10). Survival curves denoted with Ψ represent statistically significant (p>0.05) protection from a tumor challenge compared to no vaccine. (G) Summary of vaccine/challenge experiments. All filled squares represent statistically significant (p<0.05) protection from a tumor challenge compared to no vaccine. Filled black squares represent maximum observed protection from a tumor challenge (p<0.001). After subtracting survival of the challenge only group, black squares represent a survival of 70% or greater, medium grey squares represent a survival of 30–69%, and light grey squares represent a survival of less than 30%. Unfilled squares represent the same protection from a tumor challenge as the no vaccine group (p>0.05). Boxes with an “x” were not determined. Each square represents 2–4 independent experiments with 5 mice per group (n=10–20).

