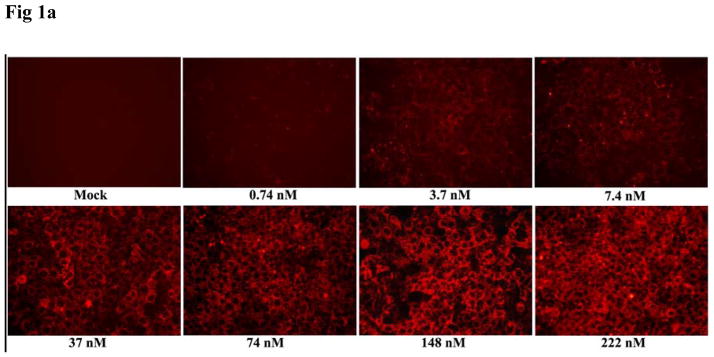
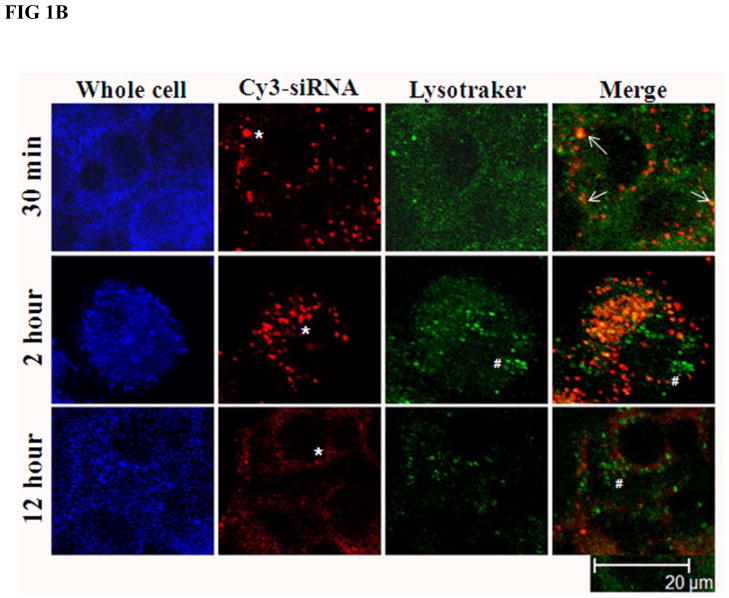
Fig. 1.
Assessment of siRNA delivery and endosomal escape following endocytosis by siRNA nanosomes. A. Optimization of siRNA delivery by using different amounts of siRNA. Huh-7 cells were transfected with increasing amounts of cy3-GAPDH siRNA nanosomes for 24 hours and the delivery of siRNA into the cells was imaged by using a fluorescence microscope at 10X magnification. B. Assessment of endosomal escape of siRNA nanosomes. Huh-7 cells were transfected with B6 for different time periods and then stained with Lysotraker Green DND-26 and To-Pro3 nuclear dye. The siRNA nanosomes (red) and endosomes (green) was imaged by Leica TCS SP2 confocal microscope. Scale bar represents 20 μm.


