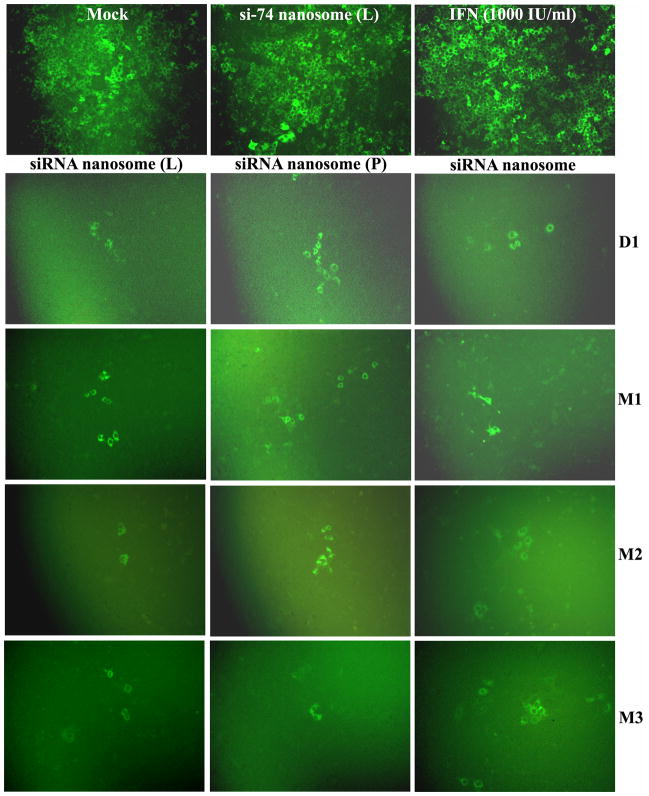
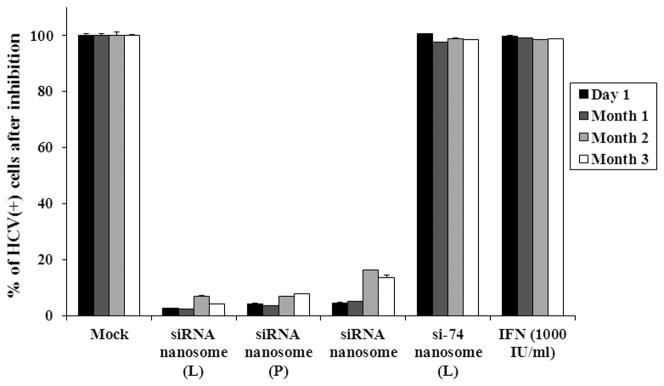
Fig. 3.
Qualitative and quantitative assessment of the inhibition of HCV replication by different siRNA nanosomes at different time points. The HCV (+) replicon cells were cultured in 6-well plates for 24 hours followed by transfection with different formulations, or with IFN for 48 hours. The cells were scraped and re-cultured for 72 hours before they were transfected for a second time with the same formulations, or with IFN for 48 hours. A. Fluorescence photographs of GFP expression using a fluorescence microscope at 10X magnification and B. Quantitative measurement of GFP expression by FACS analysis. The results represent mean ± standard deviation (n=3).


