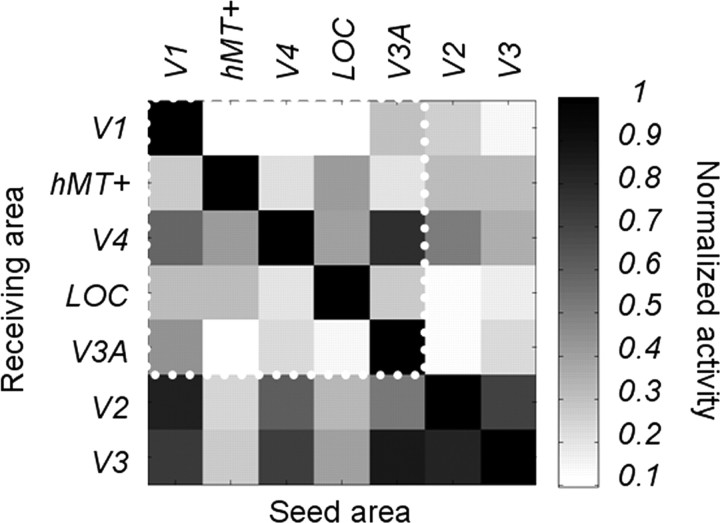
Figure 10.
Theoretical estimates of cross talk between source-imaged EEG signals in retinotopically defined visual areas. Grayscale values at row i and column j represent the relative contribution of area j to the cortical current density estimate in area i. Individual definitions from seven different areas (V1, hMT+, V4, LOC, V3A, V2, and V3) are included. The ROIs used in the study are grouped together within the white dotted line region. Areas V2 and V3, which were excluded from the analysis are also presented for comparison.

