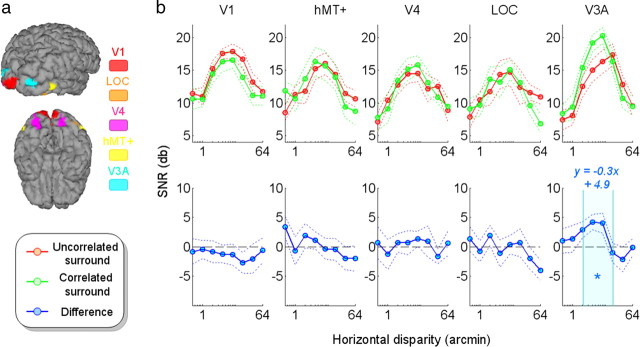
Figure 2.
Horizontal disparity tuning for the even harmonics. a, Locations of the different ROIs used in this study illustrated on one individual subject (lateral and ventral views). b, Global SNR responses averaged across subjects (in log units). The dotted lines represent the corresponding SEs. Both sets (with a correlated and an uncorrelated surround respectively) are presented on the top. The corresponding differences are displayed in the bottom. The star is associated with a p value of 0.05 (Wilcoxon test, Bonferroni corrected) for disparity values included in the 2–16 arcmin interval (emphasized by the cyan band). The corresponding equations of the linear models are displayed in blue.

