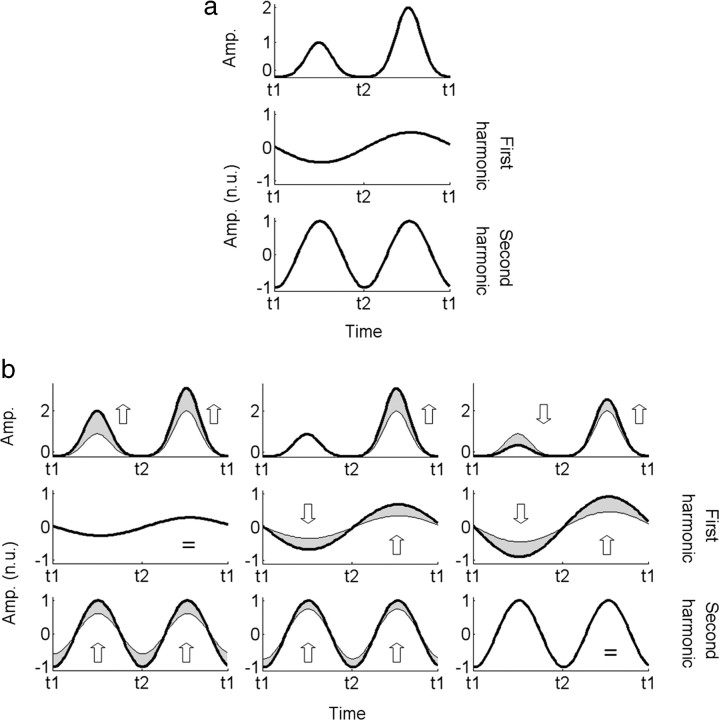
Figure 6.
Examples of hypothetical odd and even harmonic amplitude variations between two experimental conditions. a, EEG signal associated with two subpopulations for a given condition (top) and its normalized reconstruction from first- (middle) and second-harmonic (bottom) Fourier coefficients. The amplitudes were normalized according to the maximum value across the two frequencies. The central disk is behind the fixation plane between t1 (0 ms) and t2 (250 ms), and in front of it between t2 and t3 (500 ms). We used t3 = t1 to point out that the phase wraps around in steady-state stimulation. b, Variations of these amplitudes at the first and second harmonics between the uncorrelated and correlated surround conditions are indicated by the arrows. The time courses for the uncorrelated surround are presented in gray while those of the correlated surround are displayed in black. Reconstructions of the third and fourth harmonics are not shown for visibility purposes, but their characteristics may be easily deduced from the first and second harmonics. Amp., Amplitude; n.u., normalized units.

