
Figure 7.
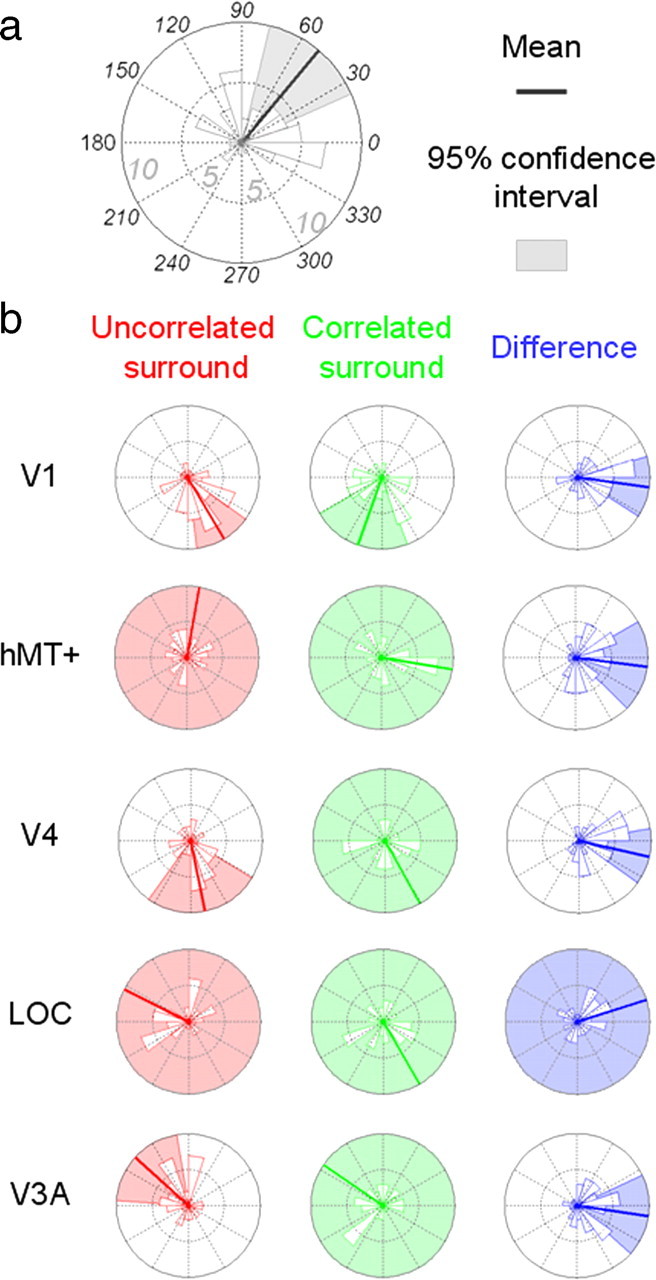
Histograms of the phases at the first harmonic (i.e., f = 2 Hz) for disparity ranging from 2 to 16 arcmin (12 subjects). Each small graphic displays the distribution of the 48 corresponding data points. a, Phases are presented in degrees on the trigonometric circle (anticlockwise progression). The number of data points included in each portion of the histograms is provided by the radius of the wedges. The inner and outer circles correspond to 5 and 10 data points, respectively. The thick lines give the means of the distributions, and the shadowed portions outline the 95% confidence interval for these means. The histograms lacking colored wedges refer to phases whose confidence intervals cannot be reliably estimated. b, Phases of the different ROIs for the uncorrelated and correlated surround (in red and green, respectively). The difference (i.e., correlated − uncorrelated) is displayed in blue.