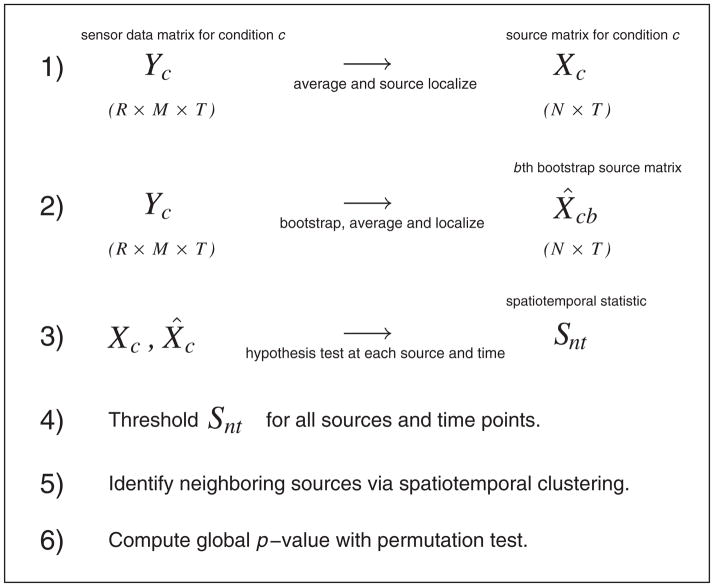
Figure 1.
Flow diagram of methodology. The data for condition c consist of M sensor signals at each of T time points across R replications (trials). In step 1, we average the sensor signals across trials and then localize (see text) to N sources in the brain. Step 2 repeats this process for bootstrapped set of trials. At step 3, we perform hypothesis tests at every source and time point to test the null hypothesis that the mean source activities are equal across conditions. We threshold these test statistics at step 4 and then identify spatiotemporal neighbors as clusters, representing potential ‘hot spots’ at step 5. We carry out a global significance test in step 6.

